A scan of the kubernetes-sigs organisation, rendered as a graph: 208 repos, 1,128 cross-repo dependencies, and 153 repos that depend on yaml.
If you’ve worked on a Kubernetes operator, you have a rough mental model of how kubernetes-sigs fits together. controller-runtime and controller-tools at the framework layer, kubebuilder above them as scaffolding, cluster-api and its army of cloud providers off to one side, kustomize and kind as standalone tools, dozens of CSI drivers each doing their own thing, and an unglamorous foundation of small utility libraries (sigs.k8s.io/yaml, sigs.k8s.io/json, sigs.k8s.io/structured-merge-diff) underneath the lot.
What you probably haven’t seen is what that mental model looks like rendered as a graph.
This is the second post in the series. The first scanned the Prometheus org with Riftmap and used it as a calibration target: 56 repos, well-understood, you could check the scanner against your own intuition. The shape mostly matched. kubernetes-sigs is the harder test. 208 public repos, structured very differently from Prometheus, no single owning team that holds the whole thing in their head.
The shape mostly matches here too. There are also a few specific things it doesn’t see, which I’ll get into below.
The biggest single observation, before any of the screenshots: kubernetes-sigs is a federation. Where Prometheus had a hub-and-spoke shape with client_golang and prometheus/common at the centre, kubernetes-sigs has a thin shared utility layer at the bottom and otherwise-independent projects on top. That’s not a flaw in the scan. It’s what a 208-repo SIG-governed org actually looks like.
The series has since scanned a third shape again: Cloud Posse turned out to be a keystone, one convention module holding up 61% of its 242 repos with a cliff and nothing in between. Three orgs, three genuinely different topologies.
The shape of the org at a glance
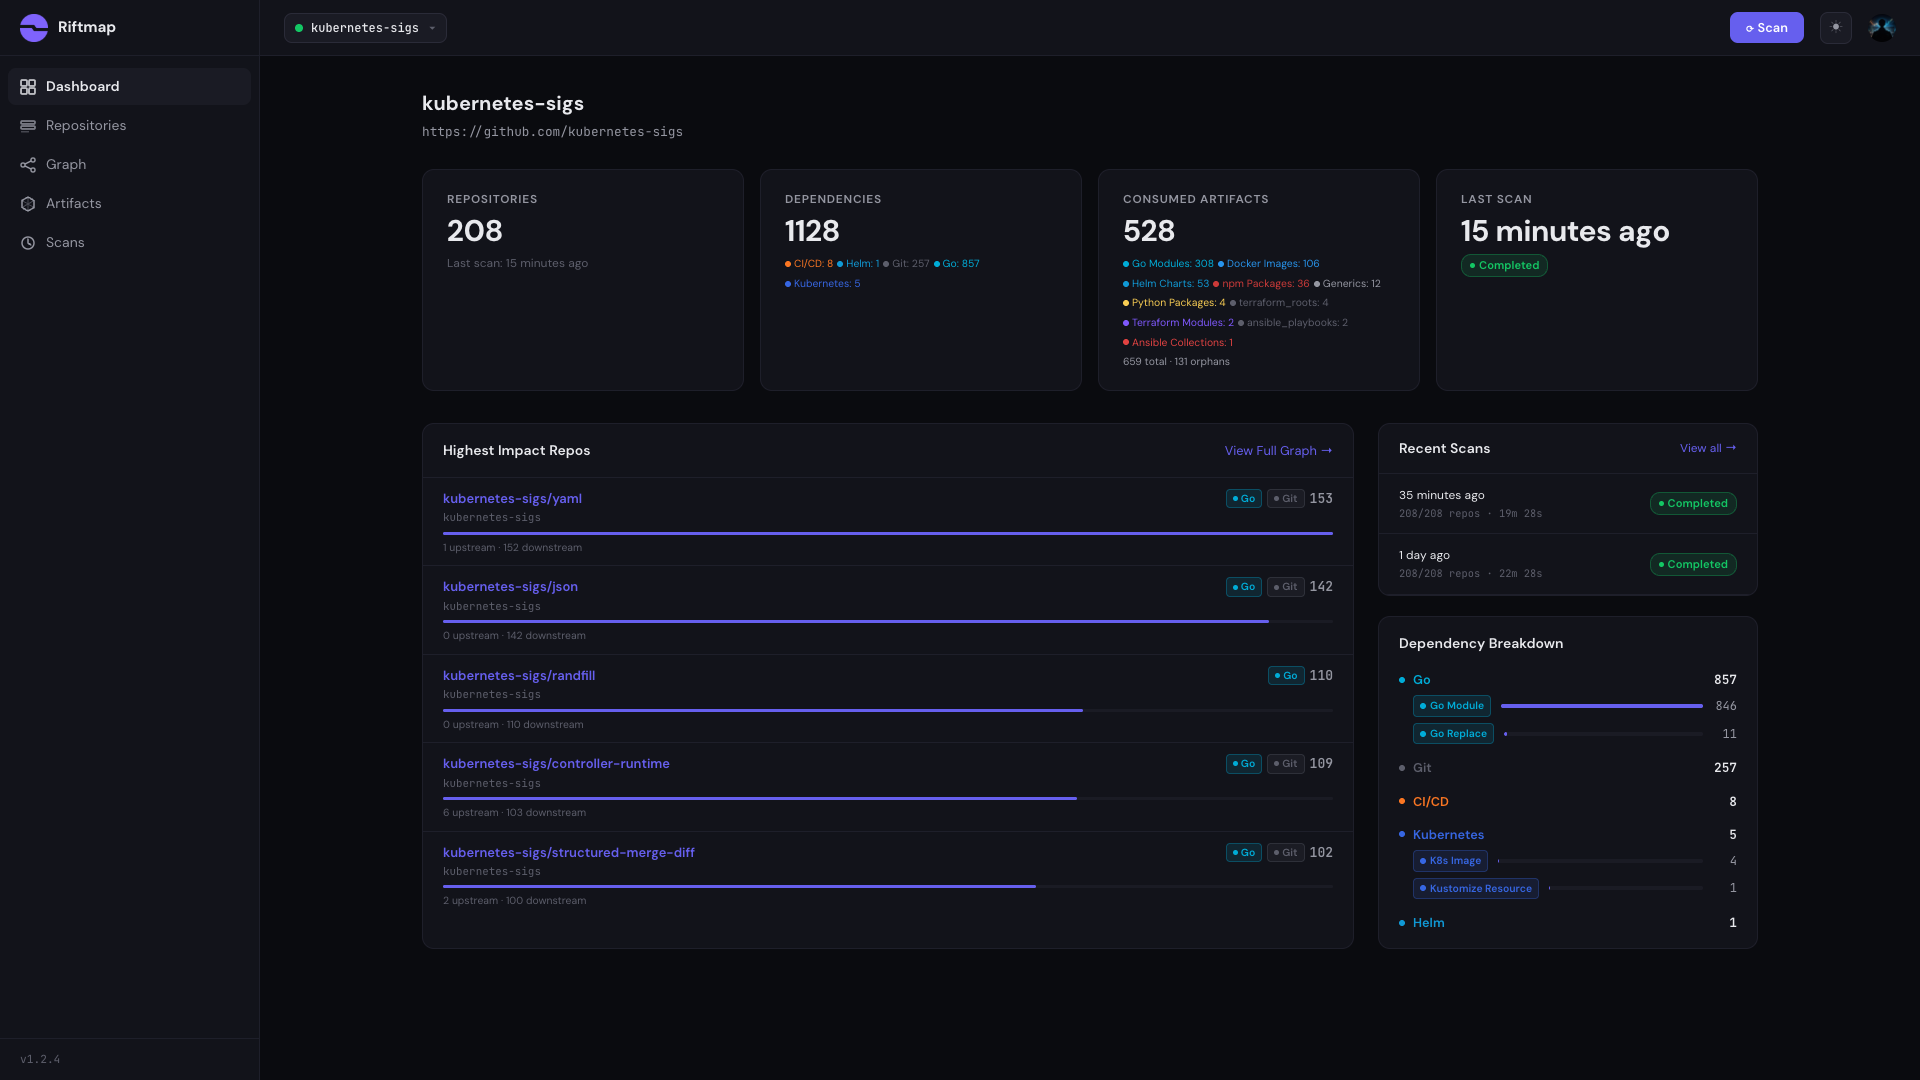
The numbers from a single scan: 208 repositories, 1,128 cross-repo dependencies, 528 distinct artifacts consumed somewhere in the org. The breakdown is heavily Go-skewed (857 Go module references, 257 git URL references, 8 GitHub Actions, 5 Kubernetes manifests, 1 Helm), which is what you’d expect for a Go-native operator ecosystem.
The top of the impact list reads about how a Kubernetes contributor would predict the bottom of it but maybe not the top:
kubernetes-sigs/yaml— 152 dependentskubernetes-sigs/json— 142 dependentskubernetes-sigs/randfill— 110 dependentskubernetes-sigs/controller-runtime— 109 dependentskubernetes-sigs/structured-merge-diff— 102 dependents
The calibration moment here isn’t quite the same as Prometheus. With Prometheus the top of the ranking confirmed the mental model: prometheus/common, client_golang, client_model, the predictable centre. The top of the kubernetes-sigs ranking has controller-runtime where you’d expect it at #4, but the three repos above it are utility libraries most contributors couldn’t pick out of a lineup. sigs.k8s.io/yaml is a thin wrapper around gopkg.in/yaml.v2 with some helpers. sigs.k8s.io/json is a small JSON marshaller. sigs.k8s.io/randfill is a randomised-value fuzzer used in test generation.
These three sit at the top because every operator-flavoured repo in the org imports them, directly or one hop away through controller-runtime or apimachinery, and Riftmap counts every direct import. The story isn’t that they’re surprising. It’s that the most-depended-on things in a 208-repo Kubernetes org are not the ones with public-facing names. That’s how shared infrastructure works.
The out-degree list tells a complementary story. Most-importing repos in the org:
| # | Repo | Out-degree |
|---|---|---|
| 1 | cluster-api | 29 |
| 2 | kueue | 29 |
| 3 | cluster-api-provider-aws | 29 |
| 4 | cluster-api-provider-azure | 27 |
| 5 | cluster-api-operator | 21 |
The cluster-api family dominates. Each provider imports the core, the shared utilities, and a dozen integration libraries. Combine the two rankings and you get the actual shape of the federation: a small utility floor at the bottom, controller-runtime as the framework layer, and the cluster-api family as the densest coordination cluster on top.
The graph view
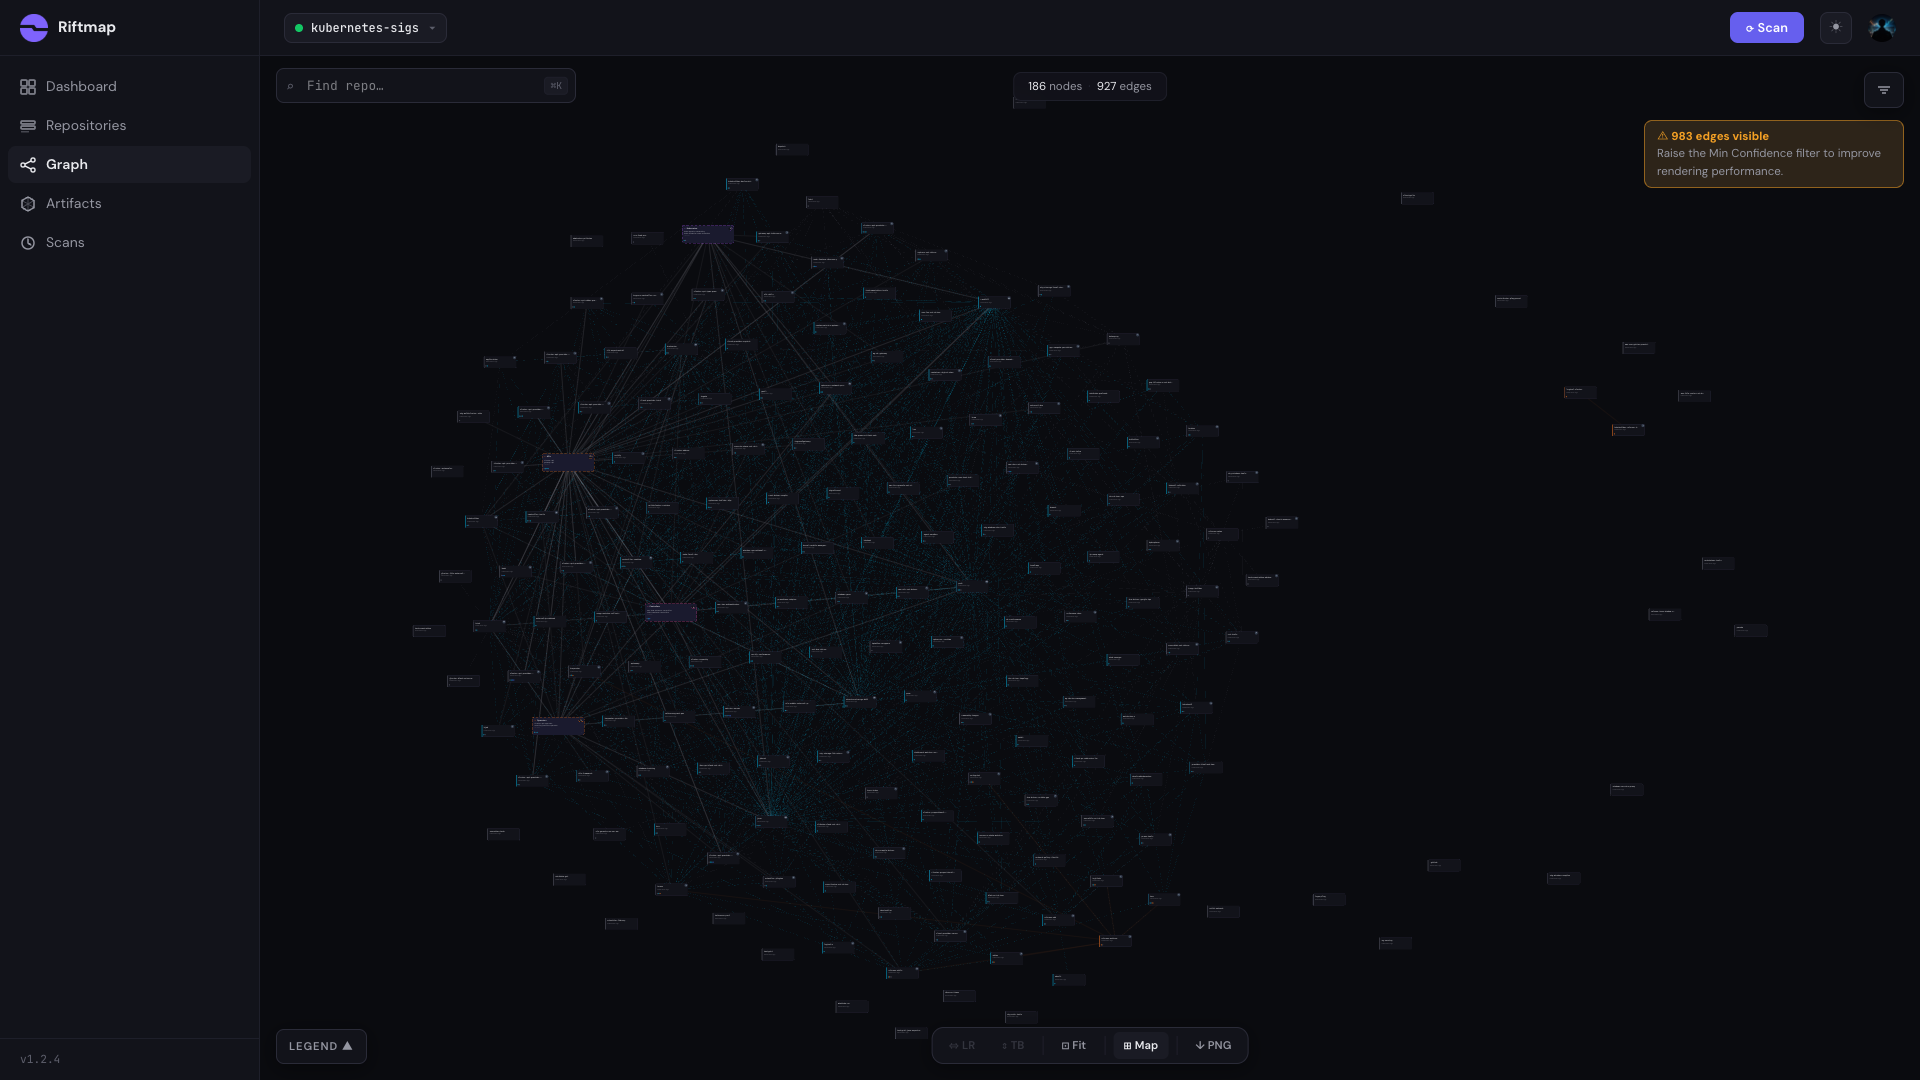
The default graph view shows the kubernetes-sigs org after auto-clustering — all 208 repos folded into a navigable set of cluster nodes. The first thing worth noticing is what’s missing. Prometheus’s graph had eight tight clusters around clear anchors (common, client_model, procfs, exporter-toolkit, promci) and a single dense hub-and-spoke pattern. kubernetes-sigs has a much flatter shape. The cluster-api family forms a recognisable group. The CSI drivers form a loose constellation. The kubebuilder-adjacent repos cluster together. And a wide row of standalone projects (kind, kustomize, gateway-api, kueue, metrics-server) sit on their own.
That isn’t a clustering failure. The auto-clustering groups repos with similar dependency profiles, and on kubernetes-sigs there genuinely are fewer profiles to find. Most cluster-api providers look like each other and cluster together. Most CSI drivers look like each other and cluster together. But kind doesn’t look like kustomize, and neither looks like gateway-api, and the graph faithfully reports that.
The clustering is what makes 208 repos legible at this zoom. Without it you get a hairball. With it you can see, at a glance, which parts of the org are coupled and which parts are independent neighbours.
The pattern at the centre
I picked cluster-api for the focus-mode shot. controller-runtime would be the easier choice. It’s the closest analogue to client_golang from the Prometheus post, with 109 in-org consumers radiating outward. cluster-api is more interesting. It sits at #10 on the in-degree ranking (38 dependents) but tied for #1 on out-degree (29 imports). That combination is rare. Most heavy importers aren’t also heavy producers. Most central repos don’t pull in two dozen of their siblings. cluster-api does both.
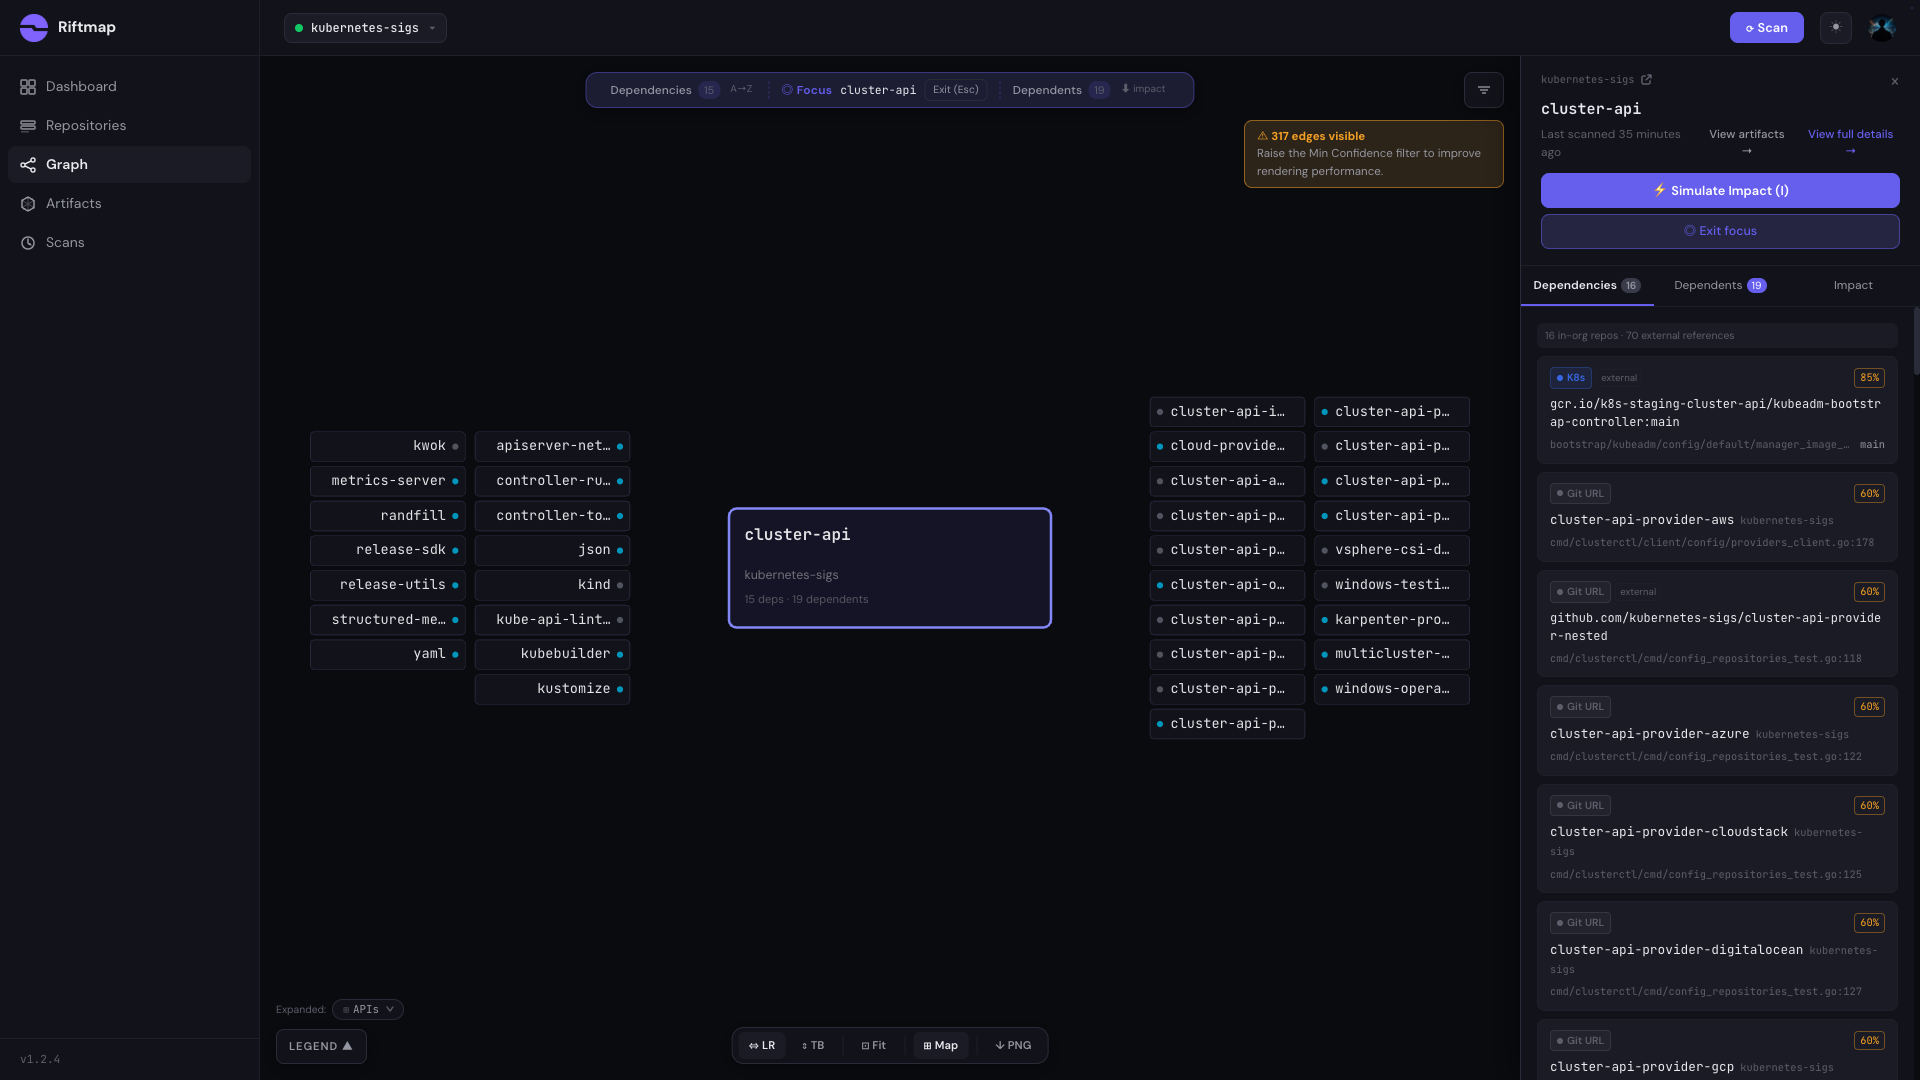
What focus mode shows: cluster-api sits in the middle of a two-sided neighbourhood. On the consumer side, the cluster-api-provider family (-aws, -azure, -gcp, -vsphere, -ibmcloud, -openstack, -cloudstack, and a long tail) fans in. On the dependency side, cluster-api pulls in controller-runtime, the shared utilities (yaml, json, randfill, structured-merge-diff), apimachinery integrations, and an observability subgraph including metrics-server.
You don’t need to be a Cluster API maintainer to read this graph. A new engineer joining one of the provider teams could open it on their first day and see the coordination layer that ties their work to everyone else’s, plus the upstream layer they share with cluster-api itself.
Where the receipts live
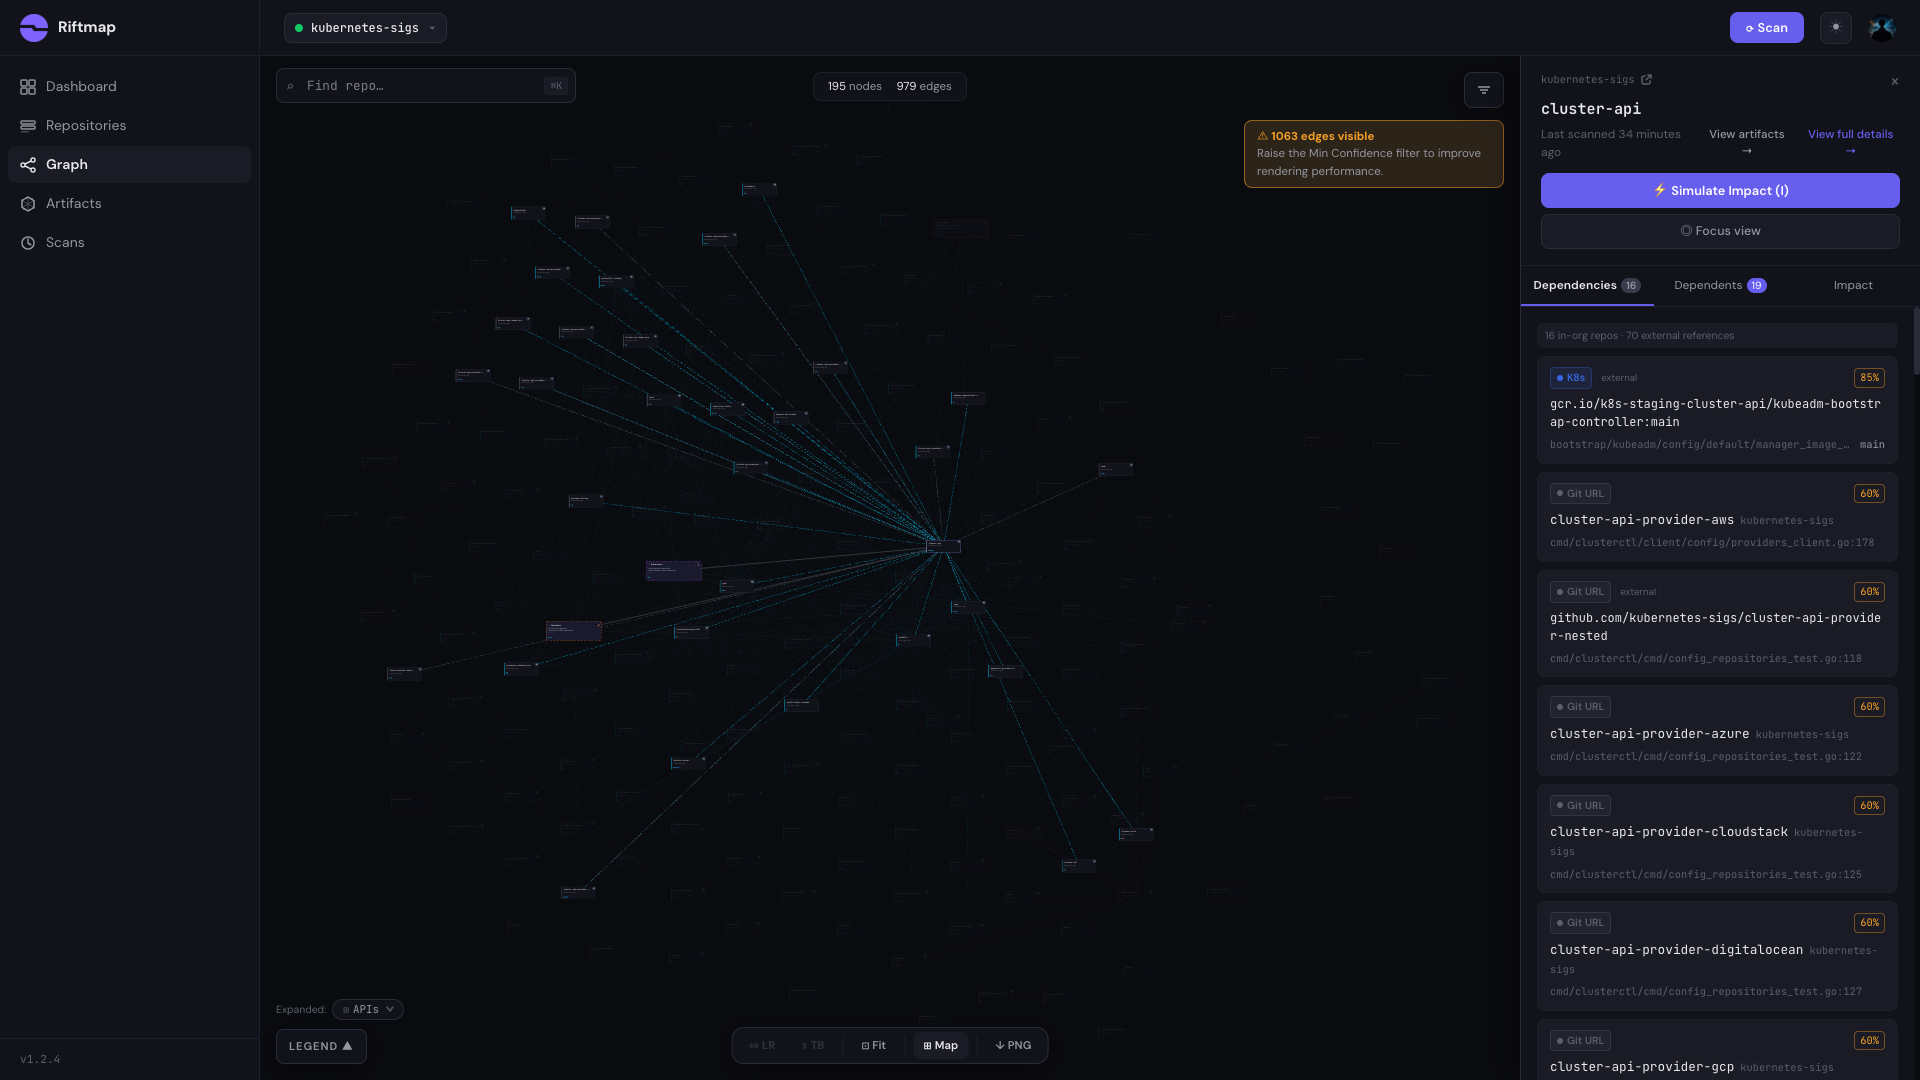
Click any node and the side panel opens with file-level evidence. For cluster-api the worth-pausing-on detail is this one: cluster-api consumes the metrics-server Helm chart at version 3.13.0, referenced from hack/observability/metrics-server/kustomization.yaml:5. Confidence 0.9.
That’s not a Go module edge. It’s a Helm chart referenced from a kustomization file, in a different repo, in a directory most contributors never open. The Prometheus post leaned hard on go.mod parsing: three separate go.mod files in prometheus/prometheus, each with its own pinned version of client_golang. Cross-ecosystem edges like the metrics-server one are where the cost of not having this kind of graph compounds. If metrics-server publishes a breaking change in the chart and cluster-api’s observability hack directory still references 3.13.0, no Go tooling will flag it. The Helm chart edge sits at confidence 0.9 rather than 1.0 because chart references resolve through registry name matching rather than exact module paths. Across the full scan, 83% of edges resolve at confidence 1.0 and the rest at 0.6 to 0.9. The confidence is part of the receipt, not a hedge.
A second receipt worth noting, on the Go side: sigs.k8s.io/yaml is imported by 149 distinct repos via two raw module paths (sigs.k8s.io/yaml and github.com/kubernetes-sigs/yaml). Both resolve to the same artifact. 212 total declarations from those 149 unique repos. The gap is the multi-module monorepos importing yaml from several go.mod files. kubernetes-sigs/cluster-addons is the strongest example: it’s a multi-module monorepo with submodules for bootstrap, coredns, dashboard, flannel, metrics-server, nodelocaldns and others. Each produces its own go_module artifact (sigs.k8s.io/cluster-addons/bootstrap, sigs.k8s.io/cluster-addons/coredns, and so on). Each submodule’s yaml import is tracked separately. “We updated yaml in the root go.mod” and “we updated every reference to yaml” remain different statements.
One related quirk: cluster-addons’ kubeproxy/go.mod declares module addon-operators/kubeproxy (no domain, no sigs.k8s.io prefix). Riftmap surfaces it exactly as declared. When you scan an org, the right behaviour is to report what’s in source rather than to normalise it.
If I changed cluster-api, what breaks?
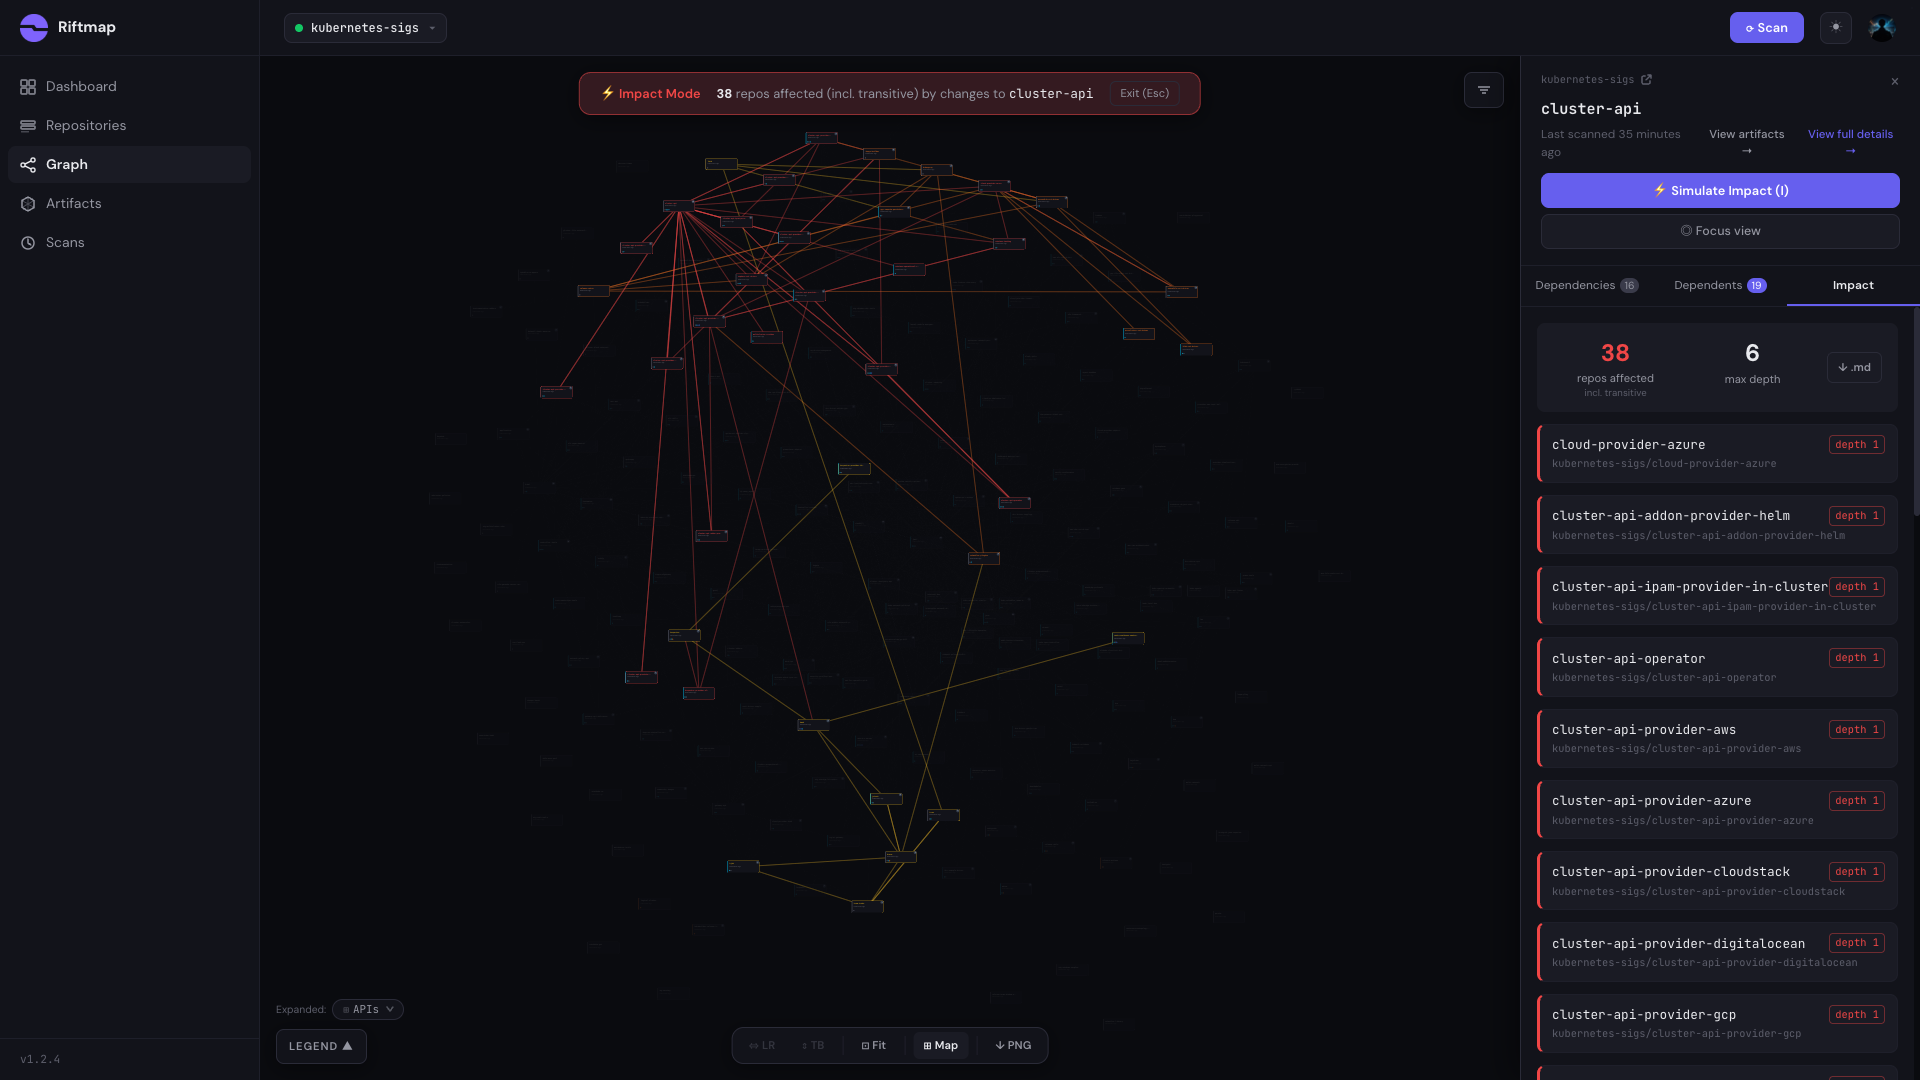
Toggle Impact Mode on the same focus view and the canvas lights up. Red cascade edges radiate from cluster-api through every repo in its blast radius. 38 repos affected at maximum depth 3: the seven cluster-api-providers you’ve heard of, the four you haven’t (kubevirt, packet, hetzner, and a handful more), cluster-api-operator, cluster-api-addon-provider-helm, the standalone consumers like kueue, and a small transitive tail.
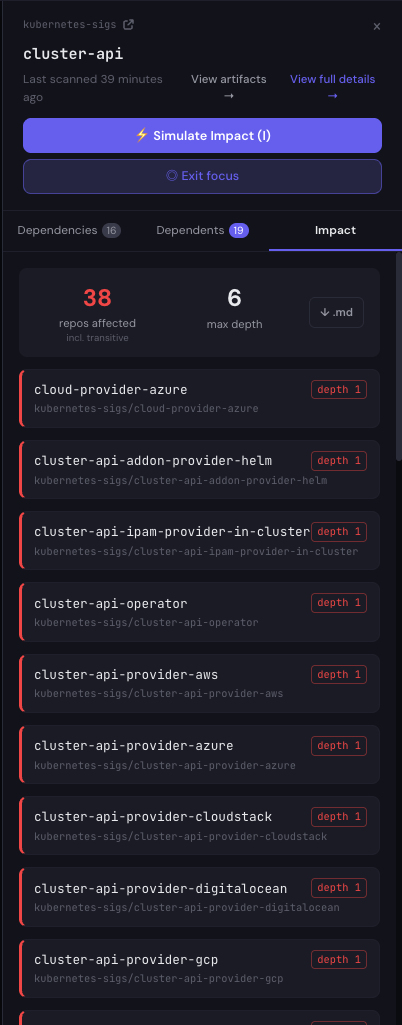
The side panel has the list with depth labels and the file:line that would need to change in each downstream. There’s a Markdown export at the bottom. Click it and you get a copyable list of every affected repo with its evidence pointers, ready to paste into a deprecation announcement, a v1beta migration RFC, or a release-notes block. That loop, “show me the blast radius and let me hand the list to the team that owns each downstream repo,” is the same workflow the Prometheus post described. The list is just longer here.
What Riftmap didn’t see (and why)
Same honesty section as the Prometheus post. Three categories.
Real parser gaps. Riftmap can’t currently parse:
pyproject.toml,requirements.txt, andsetup.py, so the four detected Python packages in the org (inference-perf,jobset,k8s-agent-sandbox,kubespray_component_hash_update) show as produced artifacts but with no cross-org consumption resolved- Terraform module consumption from a downstream repo’s
module "x" { source = "..." }blocks. Riftmap detects produced Terraform roots and modules (6 and 4 respectively) but doesn’t yet resolve the consumer side - Ansible playbook and collection consumption. Same pattern: 1 collection and 3 playbooks produced, zero consumption resolved
Cargo.toml, so the org’s one Rust experiment sits unconnected
These are real, named gaps. They are roughly the next four on the parser roadmap, in that order. Current ecosystem coverage is documented in the auto-discovery write-up.
Correctly parsed, deliberately not drawn. Most CSI driver repos sit as leaves with low or no in-degree. aws-ebs-csi-driver, azuredisk-csi-driver, gcp-compute-persistent-disk-csi-driver and their siblings have no kubernetes-sigs consumers. That’s correct. They consume k8s.io/... upstreams (different org) and external SDKs (aws-sdk-go, azure-sdk-for-go), and they produce their own container images that get consumed by cluster operators outside the org. Their dependency graph leaves kubernetes-sigs and never comes back. Drawing them as connected when they aren’t would be the bug.
The GitHub Actions edge count is similarly low (8 in-org references) for the same reason. kubernetes-sigs repos overwhelmingly use actions/checkout, actions/setup-go, actions/cache from the actions/* org. Cross-org Actions inside kubernetes-sigs are genuinely sparse. The eight that exist are real.
The single in-org Helm edge looks low until you check the chart sources. kubernetes-sigs charts mostly depend on external bases (bitnami, cert-manager, ingress-nginx, prometheus-community), all of which live in other orgs. The one in-org Helm edge that exists is the metrics-server reference above.
Federation means less clustering. Riftmap’s auto-clustering finds fewer cohesive groups on kubernetes-sigs than on Prometheus, and that reflects the org rather than a clustering shortcoming. cluster-api providers cluster tightly because they share dependency profiles. CSI drivers form a looser group. Standalone projects (kind, kustomize, gateway-api, kueue) cluster with whichever repos they happen to share imports with, which often isn’t very many. The flat shape is the finding.
The polyglot Python packages are parser gaps. The unconnected CSI drivers are correct silence. Both look the same in the graph at first glance. They are not the same thing, and the difference is what the side panel is for.
Methodology, briefly
Before Prometheus and kubernetes-sigs, Riftmap was validated against two private adversarial test groups designed to mimic production orgs. The first (27 repos, 83 expected edges) covers 20 intentional edge cases: diamond dependencies, dual-artifact repos, nested CI includes, ARG-based Docker FROM lines, Terraform subdirectory syntax, COPY --from cross-repo references, and version lag across pinned consumers. The second (55 repos, ~135 expected edges across nine ecosystems) adds cross-language artifact reuse, circular Go module deps, multi-artifact single repos, dependency chains five levels deep, and unsupported-ecosystem node rendering. Both have hand-verified ground-truth edge lists. Every scanner change is tested against them.
The kubernetes-sigs scan completed in 13m 34s across all 208 repos, with 0 skipped and no errors. 83% of edges resolved at confidence 1.0 (exact path matches); the remainder at 0.6 to 0.9 (Helm chart references and Kubernetes image references that resolve through name matching rather than exact paths).
None of the heuristics involved in artifact resolution are public. The scan output is.
Two asks
If you work on a kubernetes-sigs repo and you spot something Riftmap got wrong about it, a missing edge, a misattributed version, a parser failure I should add to the roadmap, email me at [email protected]. I’ll fix the parser and credit you in the follow-up.
If you’re running something similar in your own org and want to see what your graph looks like, Riftmap is at riftmap.dev. The kubernetes-sigs scan took about 13 minutes for 208 repos. Yours probably finishes in a fraction of that.