A scan of the Prometheus organisation, rendered as a graph: 56 repos, 197 cross-repo dependencies, and 25 repos that depend on client_golang.
If you’ve worked with Prometheus, you have a rough mental model of how its 50-odd repos fit together: a core server, a client library, a constellation of exporters, some shared infrastructure. What you probably haven’t seen is what that mental model looks like rendered as a graph, or what it tells you about the blast radius of changing any one repo.
I scanned the Prometheus org with Riftmap, the tool I built for mapping cross-repo dependencies. The point of starting here isn’t to surface anything exotic. It’s the opposite: Prometheus is well-known enough that you can check the scanner’s output against your own intuition. If the shape doesn’t match, the tool is broken.
The shape mostly matches. There are also a few specific things it doesn’t see, which I’ll get into below.
The shape of the org at a glance
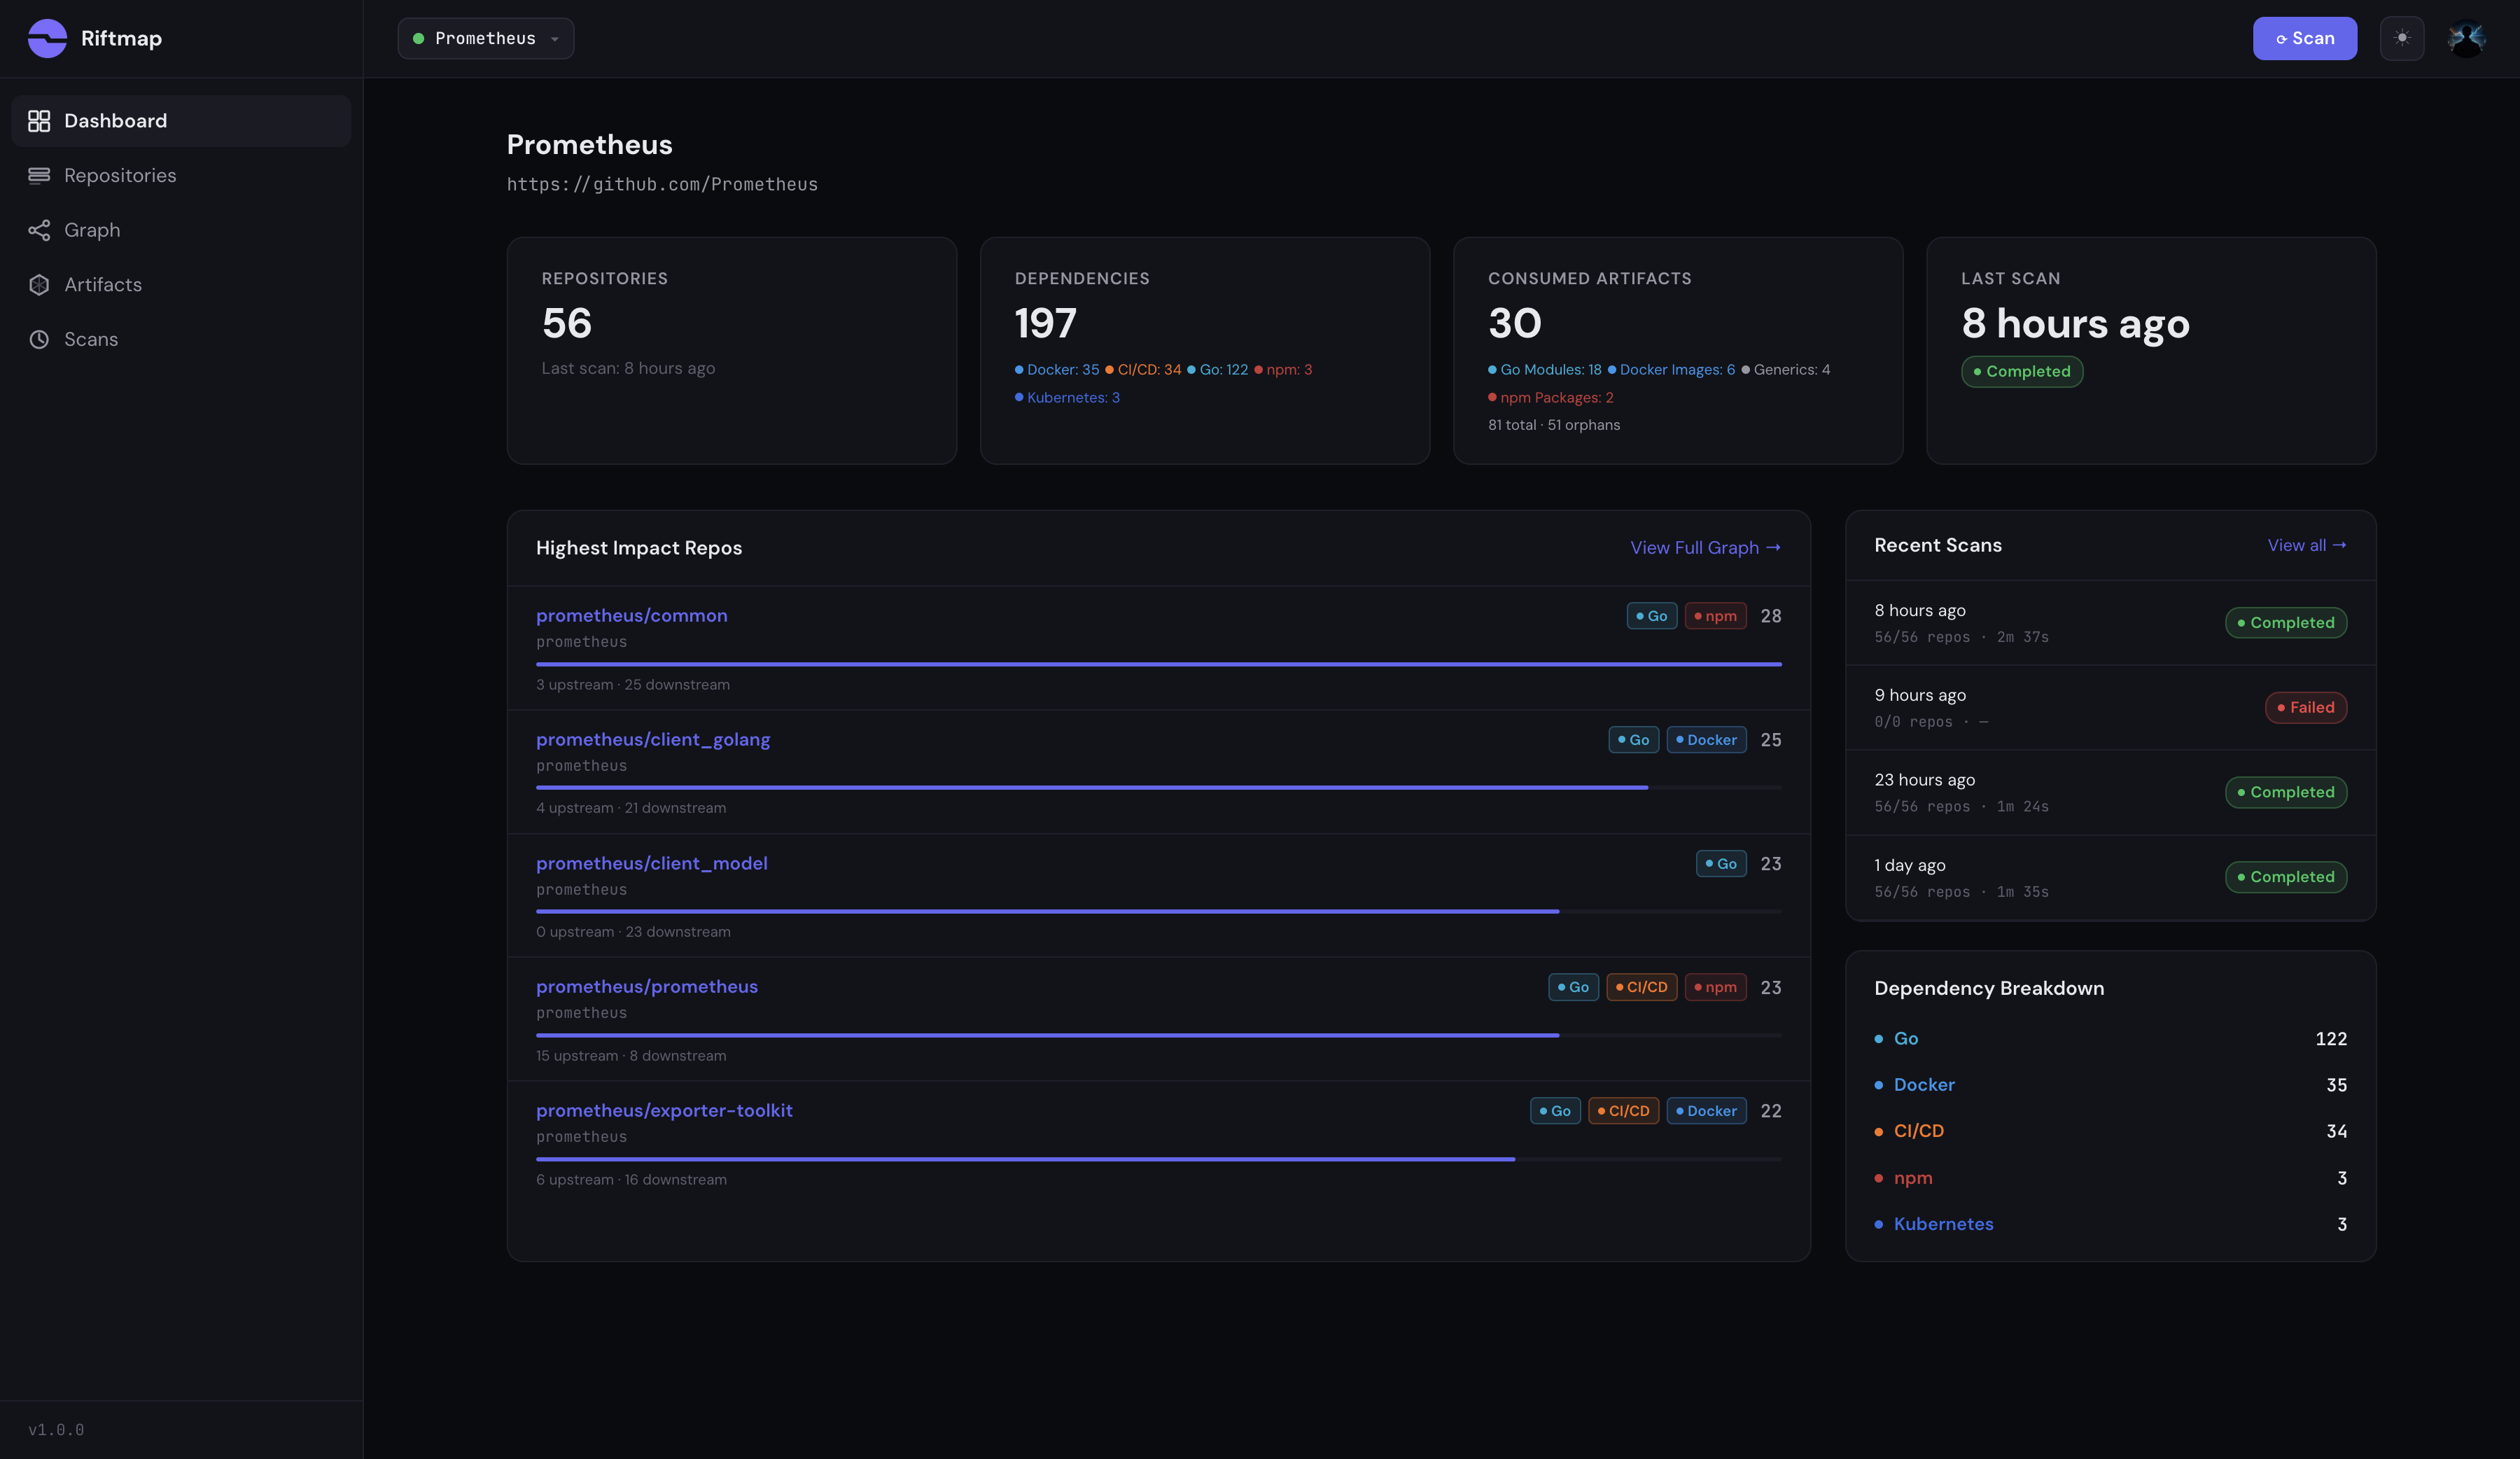
The numbers from a single scan: 56 repositories, 197 cross-repo dependencies, 30 distinct artifacts being consumed somewhere in the org. The breakdown skews Go-heavy (122 Go module references, 35 Docker, 34 CI/CD includes, 3 npm, 3 Kubernetes), which is what you’d expect for a Go-native observability stack.
The top of the impact list reads about how a Prometheus contributor would predict it:
prometheus/common— 28 dependentsprometheus/client_golang— 25 dependentsprometheus/client_model— 23 dependentsprometheus/prometheus— 23 dependentsprometheus/exporter-toolkit— 22 dependents
If you’d guessed this ranking unprompted you’d have gotten most of it right. That’s the calibration: the ranking confirms the mental model rather than challenging it. Where the graph starts paying for itself is one layer down, when you ask not just “what’s central” but “what specifically depends on this, and through which file.”
The graph view
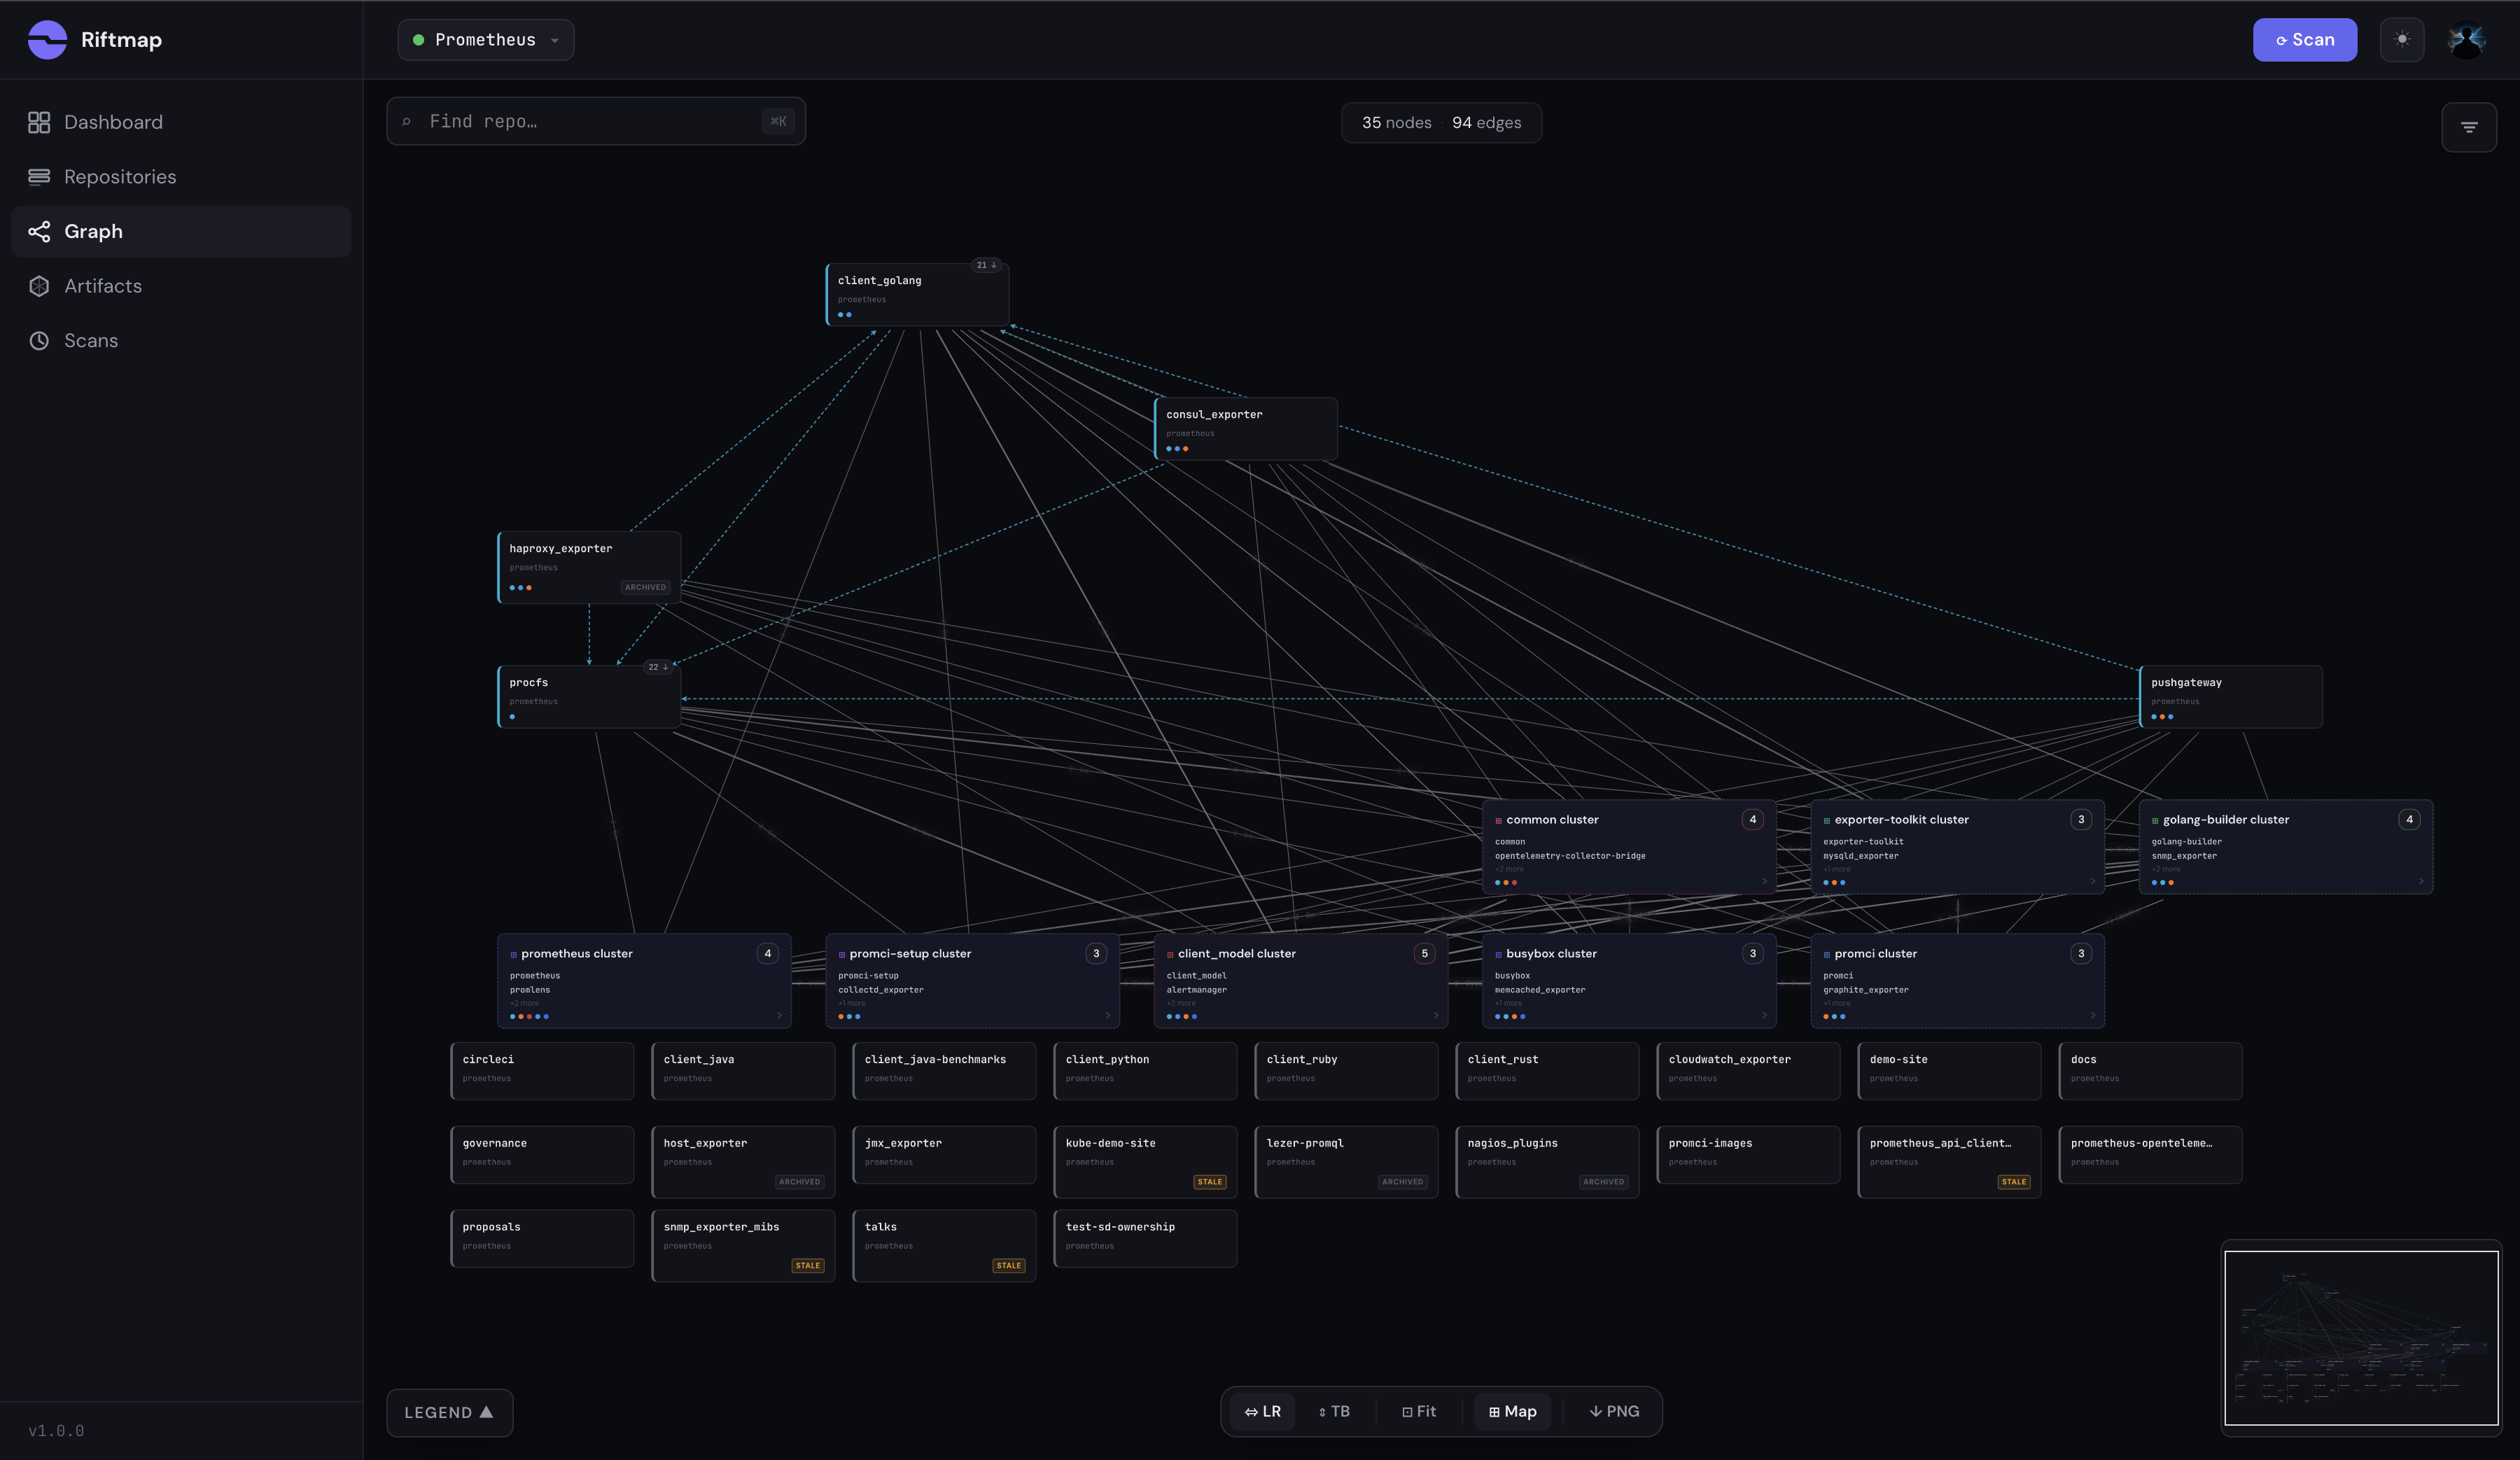
The default graph view shows 35 nodes and 94 edges, after Riftmap’s auto-clustering groups repos with similar dependency profiles. Eight clusters surface in this scan: a common cluster anchored on prometheus/common, a client_model cluster grouping the libraries that import the data model, a promci cluster for shared CI infrastructure, an exporter-toolkit cluster pulling in the exporters that depend on it, and a procfs cluster around the Linux process-level libraries. The remaining three are smaller groupings that the auto-clustering pulls out based on shared dependency profiles.
The bottom rows are the foundation: repos with no detected in-org edges. Some of those are intentional and I’ll come back to them. The clustering is what makes 56 nodes legible at this zoom level. Without it you get the standard hairball graph that no one ever zooms into a second time.
The pattern at the center
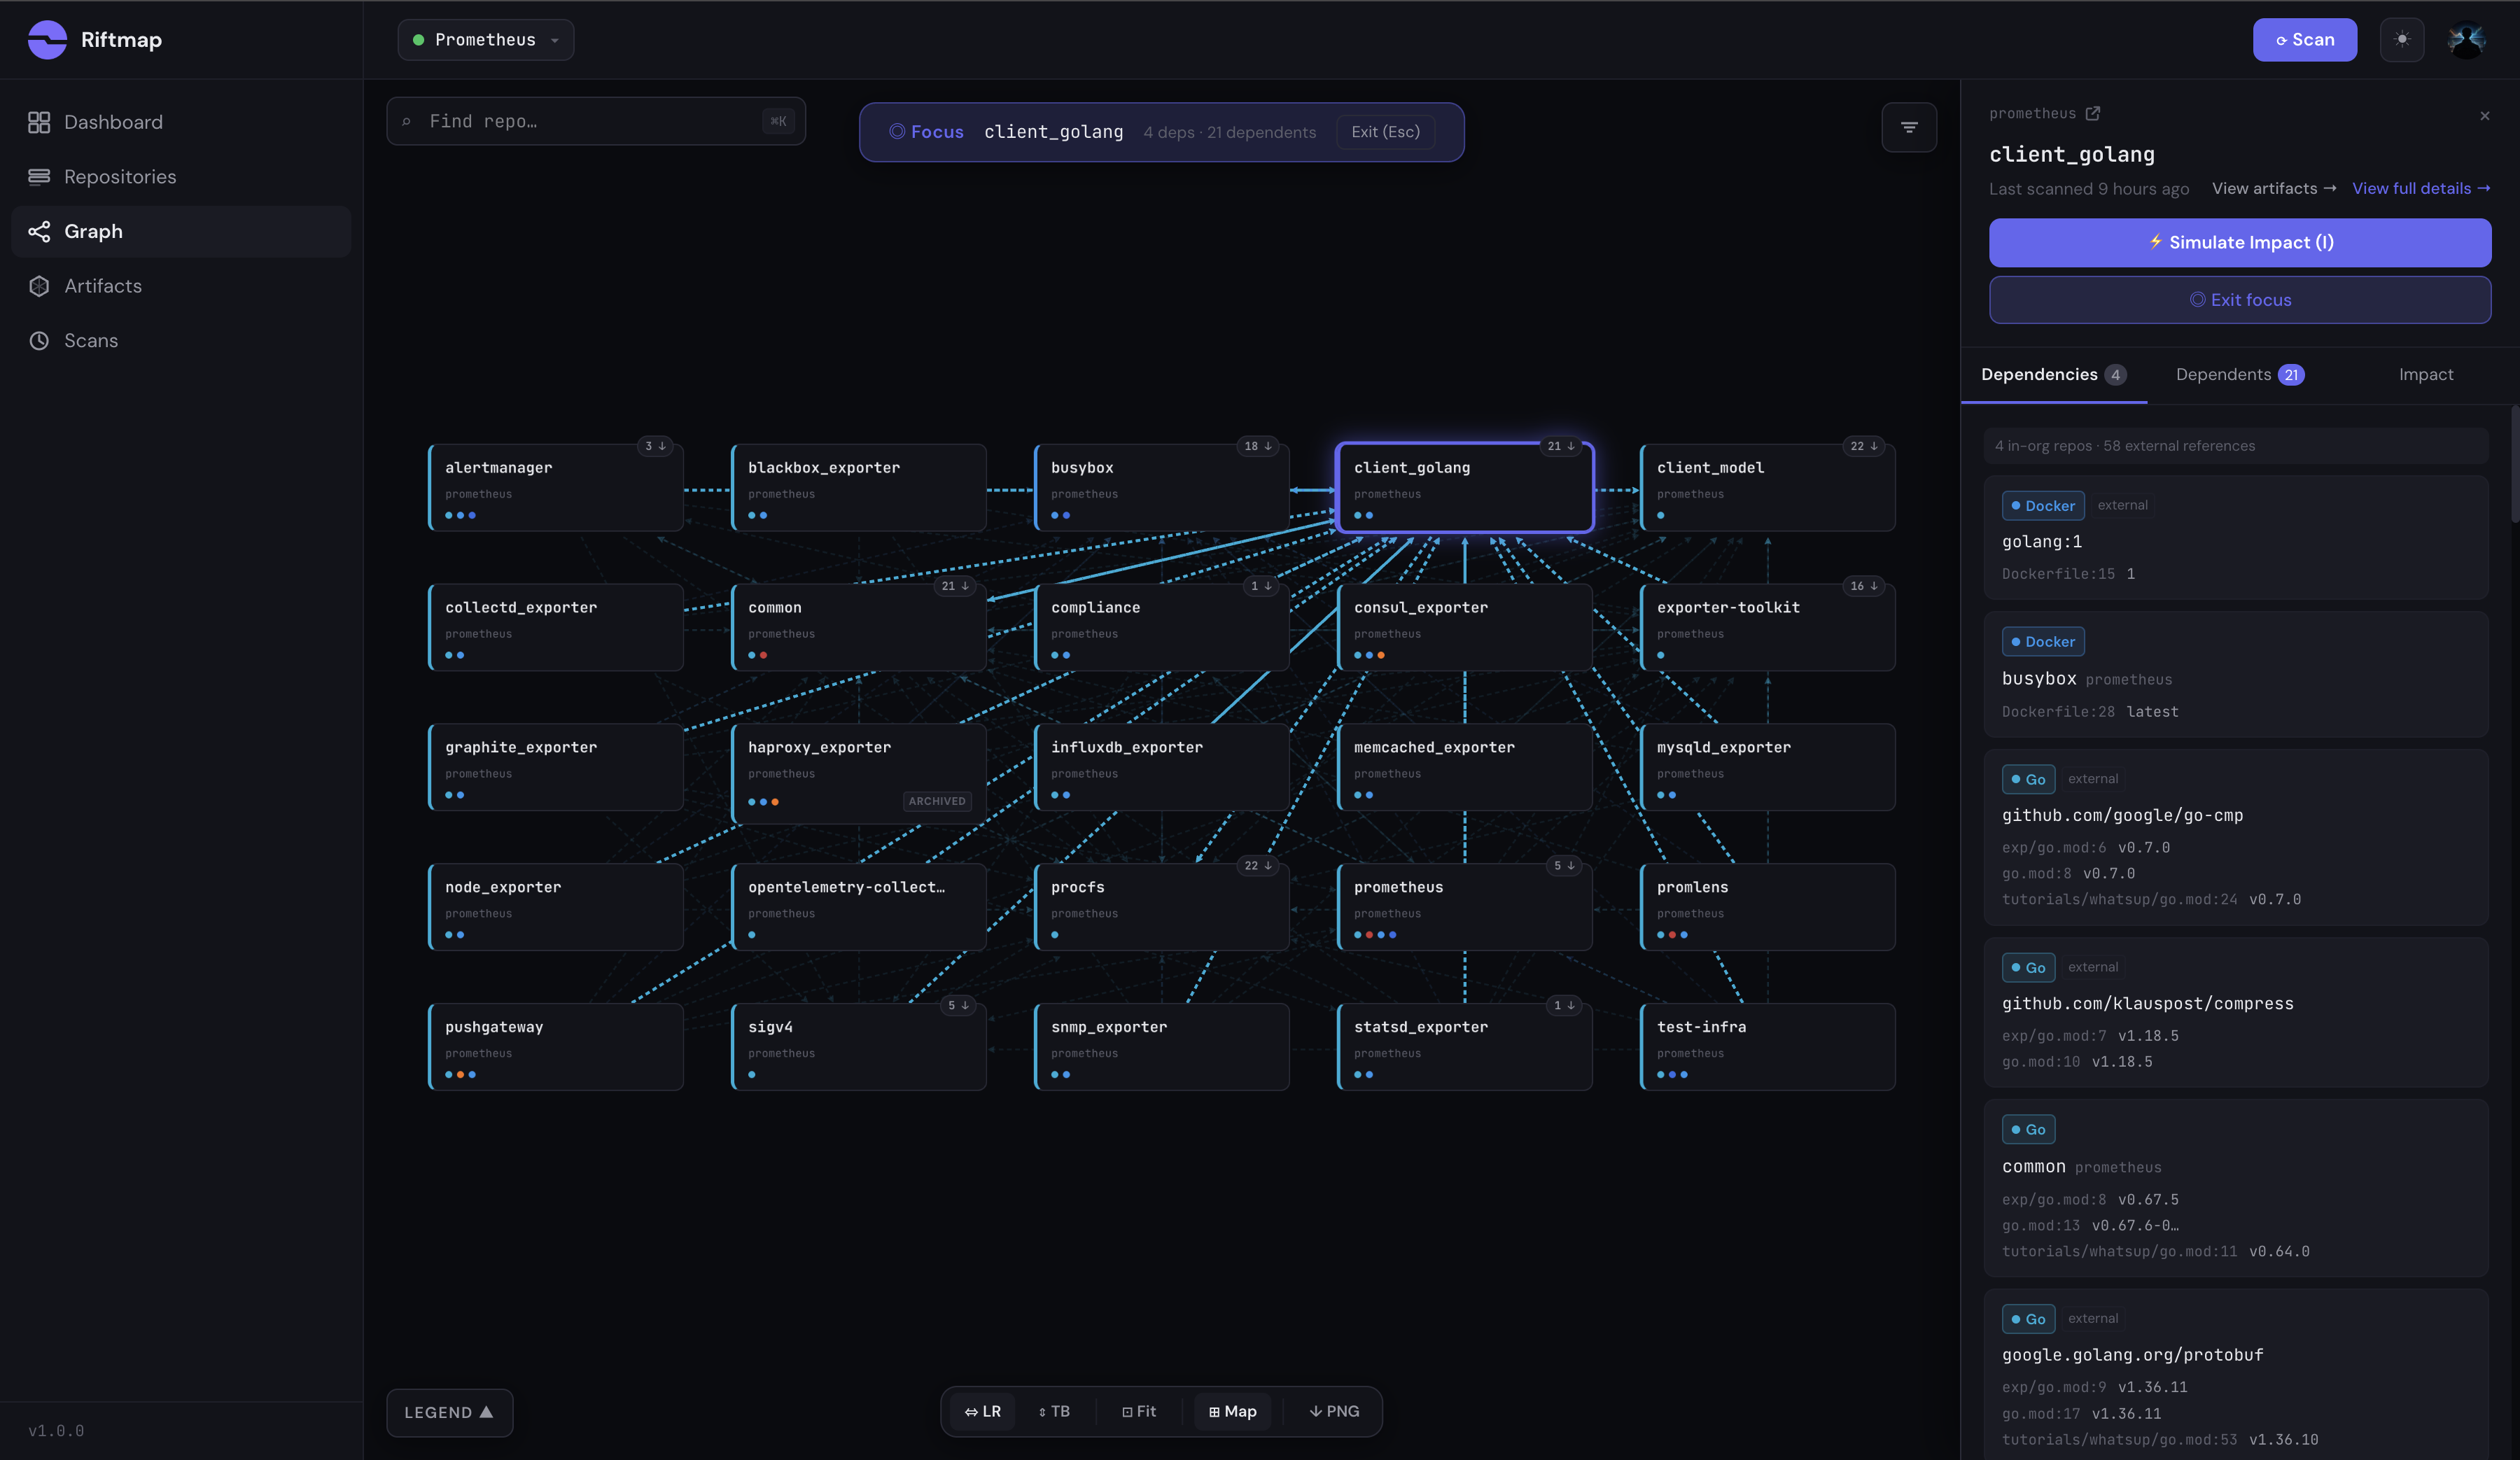
This is the strongest single screenshot in the scan. Focus mode on client_golang strips the canvas down to that repo and its 25-repo neighborhood. Every Prometheus exporter you’ve heard of (alertmanager, node_exporter, blackbox_exporter, snmp_exporter, statsd_exporter, consul_exporter, memcached_exporter, mysql_exporter, haproxy_exporter, pushgateway) sits one edge away.
The pattern is exactly what the design intent says it should be: every exporter in the org imports the canonical Go client library. The graph captures it cleanly, and you can read the relationship from a single pane without grepping through 25 separate go.mod files.
This is also where the “external observer” framing earns its keep. You don’t need a Prometheus maintainer to walk you through which repos depend on client_golang. A new engineer joining the org could open this graph on their first day and see the topology a senior engineer carries in their head.
Where the receipts live
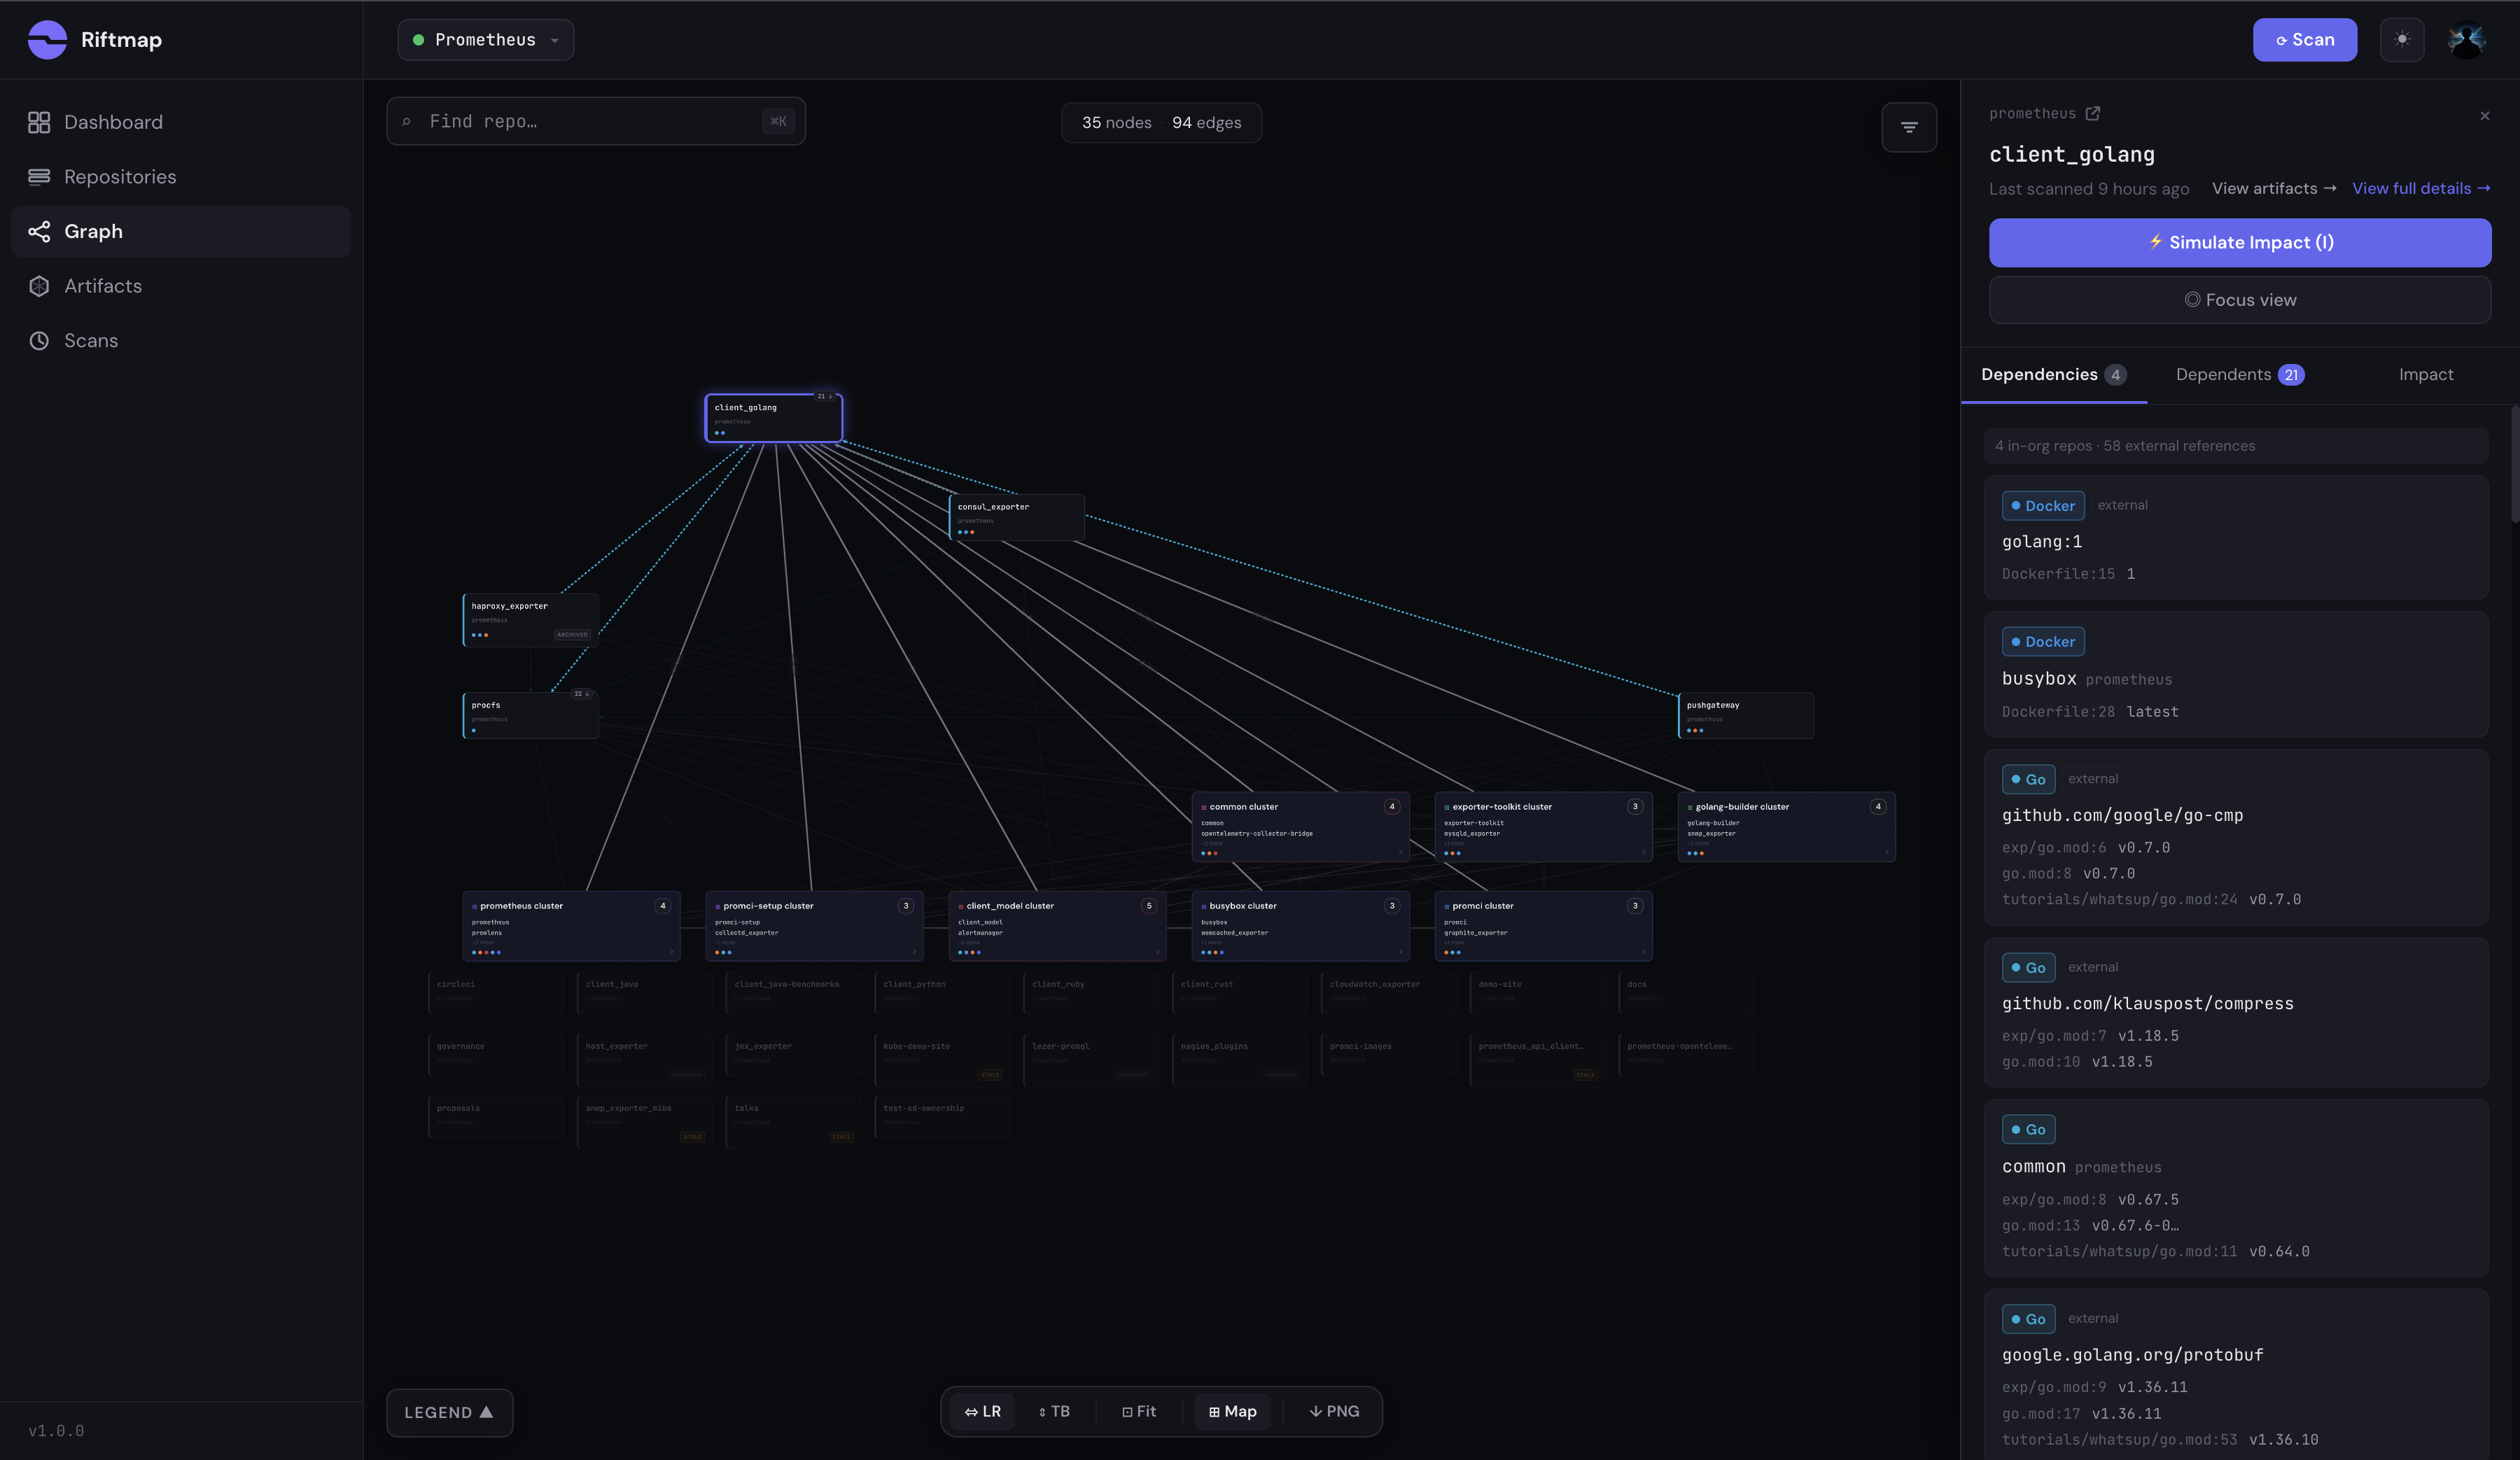
Click any node and the side panel opens with the file-level evidence behind every edge. For client_golang: 4 in-org consumers, 58 external references resolved across go.mod, Dockerfile, and similar manifests.
The detail worth pausing on: client_golang shows up in the prometheus/prometheus repo three separate times, at exp/go.mod:6, go.mod:8, and tutorials/whatsup/go.mod:24. Three distinct go.mod files in one repo, each importing the same library, each tracked as its own reference with its own pinned version. If you’ve ever bumped a dependency in the root go.mod and forgotten the one buried in tutorials/whatsup/, this is the class of bug that hides in Go monorepos. Riftmap surfaces each manifest individually rather than collapsing them into a single repo-to-repo edge, specifically because “we updated the dependency” and “we updated every reference to the dependency” are not the same statement.
If I changed client_golang, what breaks?
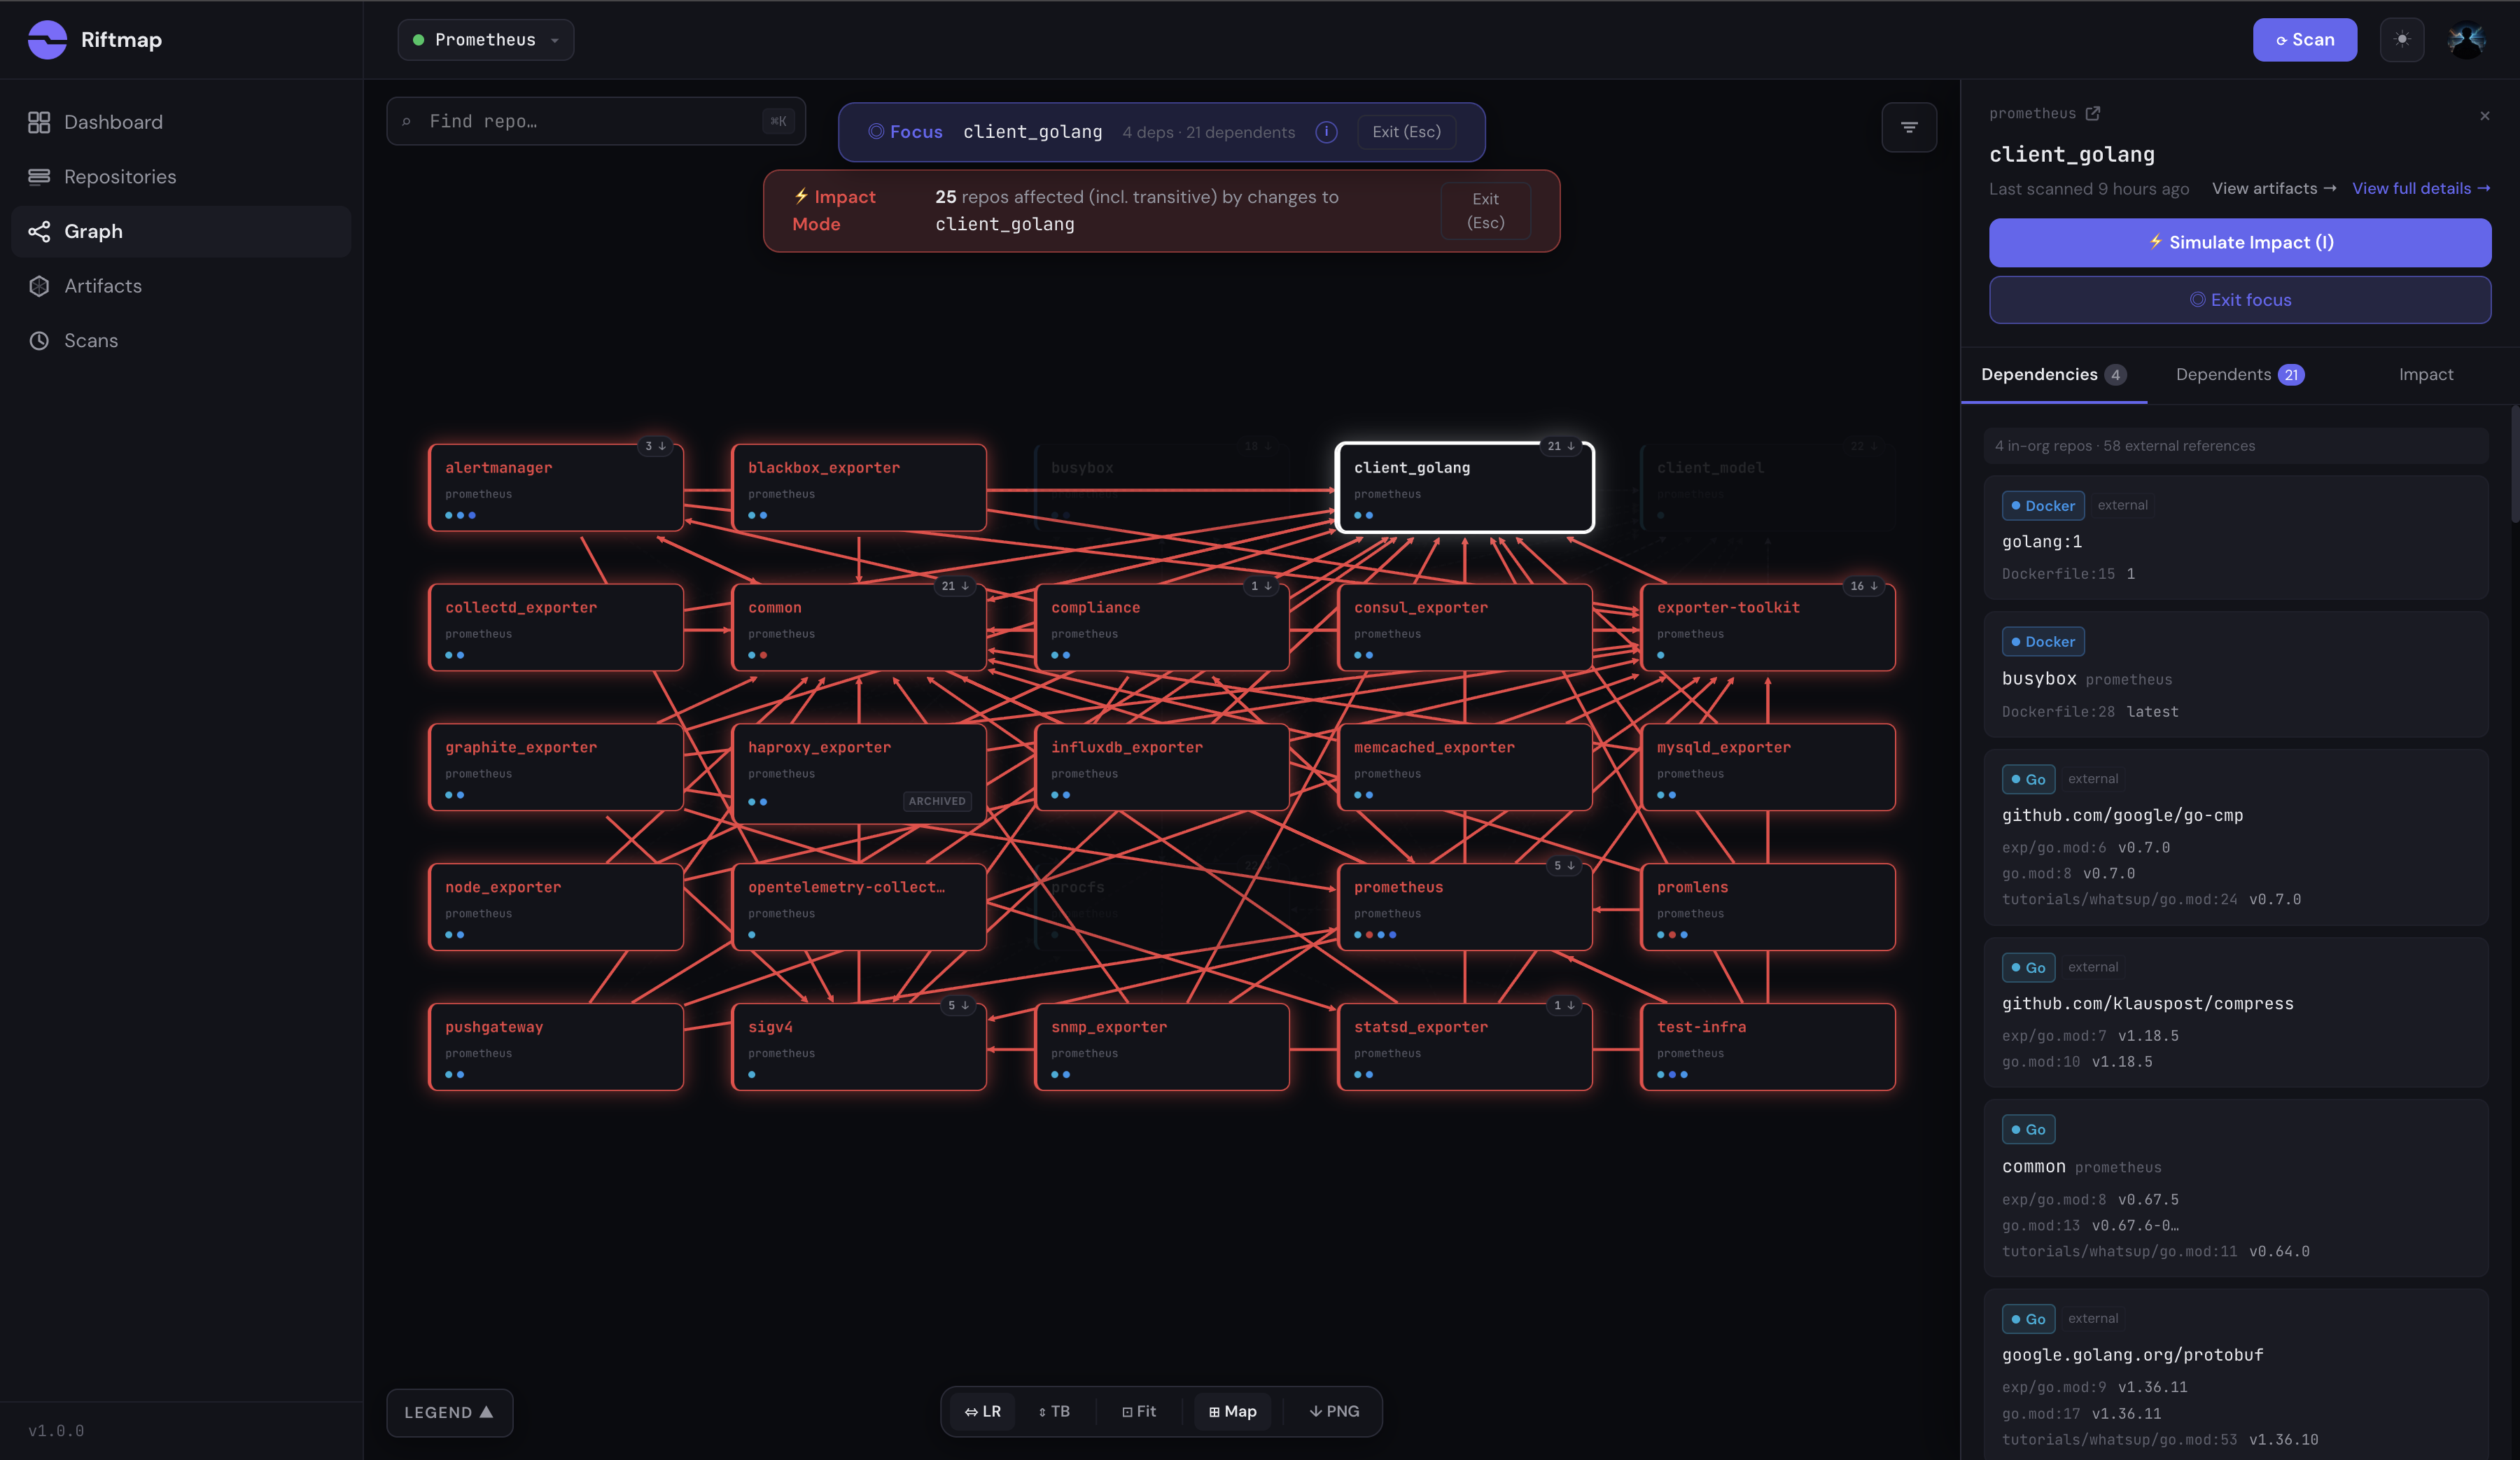
Toggle Impact Mode on the same focus view from the previous section and the canvas lights up. Red cascade edges radiate outward from client_golang through every repo in the blast radius. 25 repos affected at maximum depth 2: 24 direct dependents and 1 transitive. Every exporter, the alertmanager, pushgateway, the test infrastructure repo, all visible in a single pane.
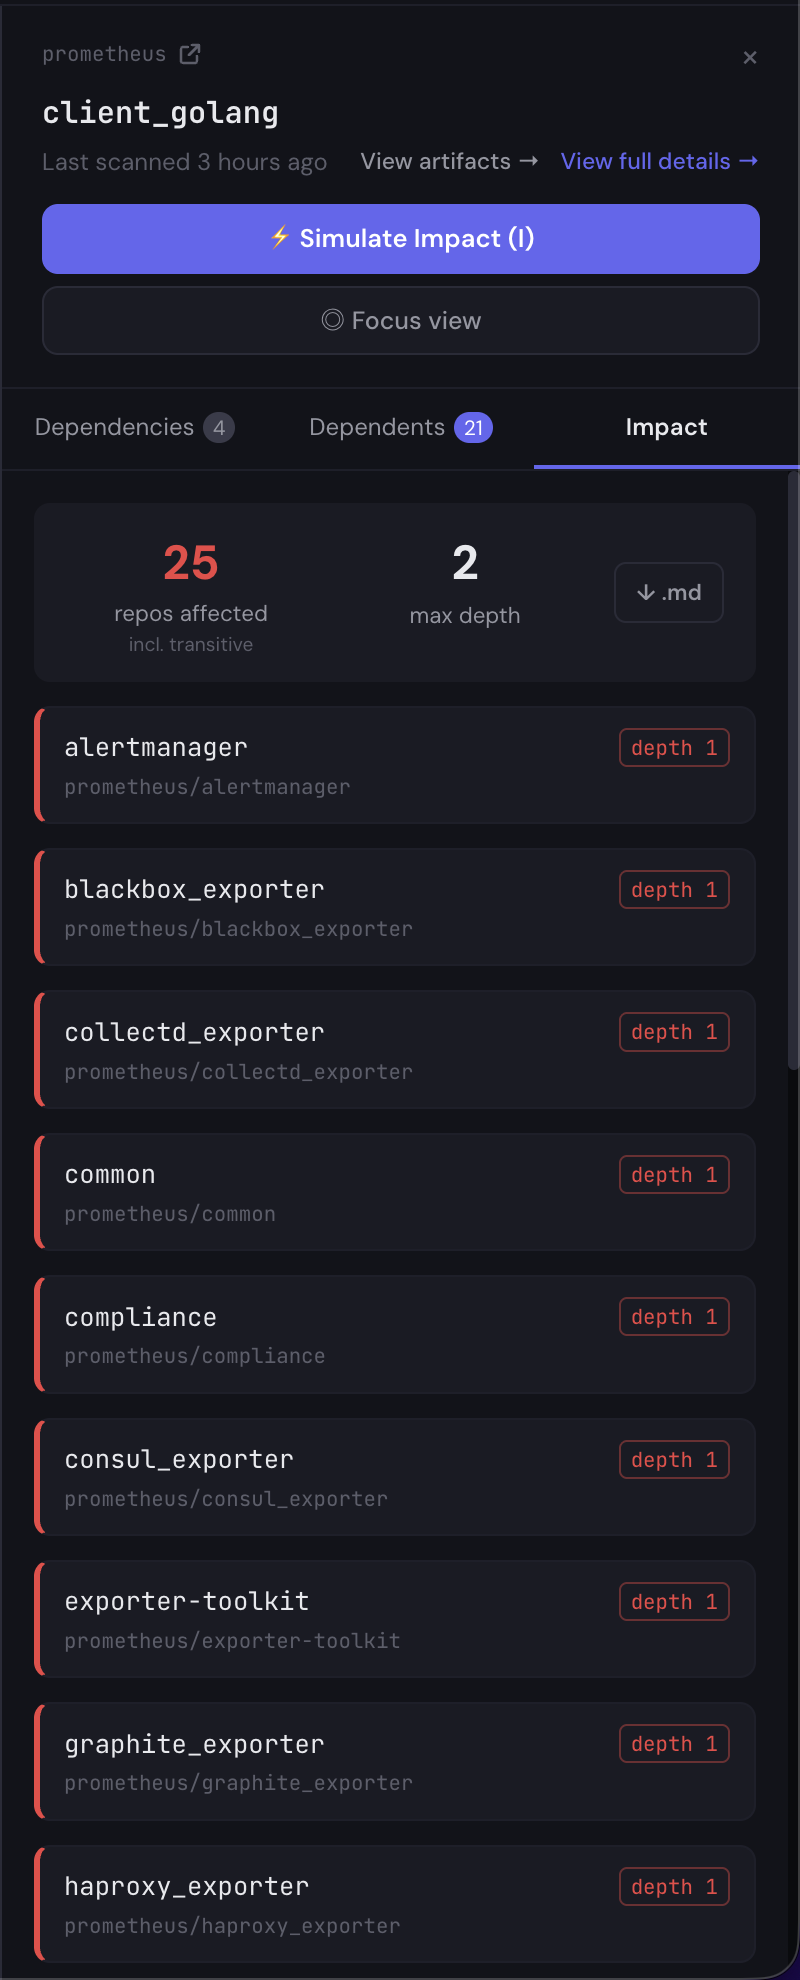
The side panel has the receipts. Each affected repo is listed with its depth label and the file:line of the import that would need to change. There’s a Markdown export at the bottom of the panel. Click it and you get a copyable list of every affected repo with file references, ready to paste into a deprecation announcement, a migration RFC, or a release-notes block. That workflow, “show me the blast radius and let me hand the list to the team that owns each downstream repo,” is the loop the tool is designed for.
What Riftmap didn’t see (and why)
The “what we missed” section in a scan write-up matters more than any of the wins above. Two distinct things are happening in the bottom row of orphan repos in the graph, and the difference is worth being precise about.
Real parser gaps. Riftmap can’t currently parse:
pom.xmland Maven coordinates, soclient_java,client_java-benchmarks, andjmx_exportercome out unconnectedpyproject.tomlandsetup.py, soclient_pythonshows no edgesGemfile, soclient_rubyandprometheus_api_client_rubyshow no edgesCargo.toml, soclient_rustshows no edges
These are real, named gaps. The repos exist, they have published dependencies, and Riftmap’s view of the org is missing their cross-repo relationships because the parsers don’t exist yet. They are the next four ecosystems on the parser roadmap, in roughly that order. If you see something like this in your own org’s scan, this is what it means. The current ecosystem coverage is documented in the auto-discovery write-up.
Correctly parsed, deliberately not drawn. Different category: lezer-promql shows up in the orphan row, but if you click into it the side panel reads “0 in-org repos · 5 external references” and lists every detected dependency: @lezer/generator ^0.15.2, @lezer/lr ^0.15.8, @rollup/plugin-node-resolve ^9.0.0, mocha ^8.1.3, rollup ^2.27.1. The npm parser ran. It read package.json. It extracted all five dependencies cleanly. They’re just not in the Prometheus org, so they don’t produce in-org edges, and the repo correctly appears as a leaf.
That distinction is the whole point of an in-org dependency graph: it tells you what your own changes cascade into, not what the entire npm registry contains. lezer-promql’s dependencies all leave the org, so the graph faithfully reports zero in-org edges. That’s a feature.
The polyglot client libraries are a parser gap. lezer-promql is correct silence. Both look the same in the graph at first glance. They are not the same thing.
Methodology, briefly
Before Prometheus, Riftmap was validated against two private adversarial test groups designed to mimic production orgs. The first (27 repos, 83 expected edges) covers 20 intentional edge cases: diamond dependencies, dual-artifact repos, nested CI includes, ARG-based Docker FROM lines, Terraform subdirectory syntax, COPY --from cross-repo references, and version lag across pinned consumers. The second (55 repos, ~135 expected edges across 9 ecosystems) adds cross-language artifact reuse (one proto repo consumed by Python, Go, and npm), circular Go module deps, multi-artifact single repos, dependency chains five levels deep, and unsupported-ecosystem node rendering. Both groups have a hand-verified ground-truth edge list that every scanner change is tested against. The Prometheus scan completed in 2m37s across all 56 repos. None of the heuristics involved in artifact resolution are public; the scan output is.
Two asks
If you work on Prometheus and you spot something Riftmap got wrong about a repo you maintain, a missing edge, a misattributed version, a parser failure I should add to the roadmap, email me at [email protected]. I’ll fix the parser and credit you in a follow-up.
If you’re running something similar in your own org and want to see what your graph looks like, Riftmap is at riftmap.dev. The scan I ran on Prometheus took under three minutes. Yours probably takes about the same.