01 / base-image update
You update a base image.
Three hours later, Slack explodes.
appears at ~50 repos base-image ───▶ 17 consumers ───▶ 41 transitive
Change a shared base image, Terraform module, or Helm chart — and know exactly which repos are affected, before you ship. Riftmap parsed the infrastructure dependencies that code-level tools never see, straight from a GitLab or GitHub org: the ones that otherwise live only in a senior engineer's head. No catalog to maintain.
ran as a hosted service until november 2026. the showcase graphs are saved scans of real public orgs, and still run in your browser.
Built in Norway by a solo founderCode-symbol tools stop at the language boundary. Riftmap parsed the infrastructure layer beyond it.
Somewhere around fifty repositories, the mental model breaks. The senior engineer who held the graph in their head takes a week off, and suddenly a one-line change in a base image lights up Slack for three hours.
AI ships code 10× faster — and none of it checks a single cross-repo edge before merging. The blast radius problem you were going to hit at 100 repos, you now hit at 50. That cross-repo reach has a name: the AI agent blast radius.
A complete lens on your infrastructure's interconnections — across every ecosystem your team actually uses.
Interactive graph of every cross-repo relationship — pan, zoom, filter by ecosystem or team.
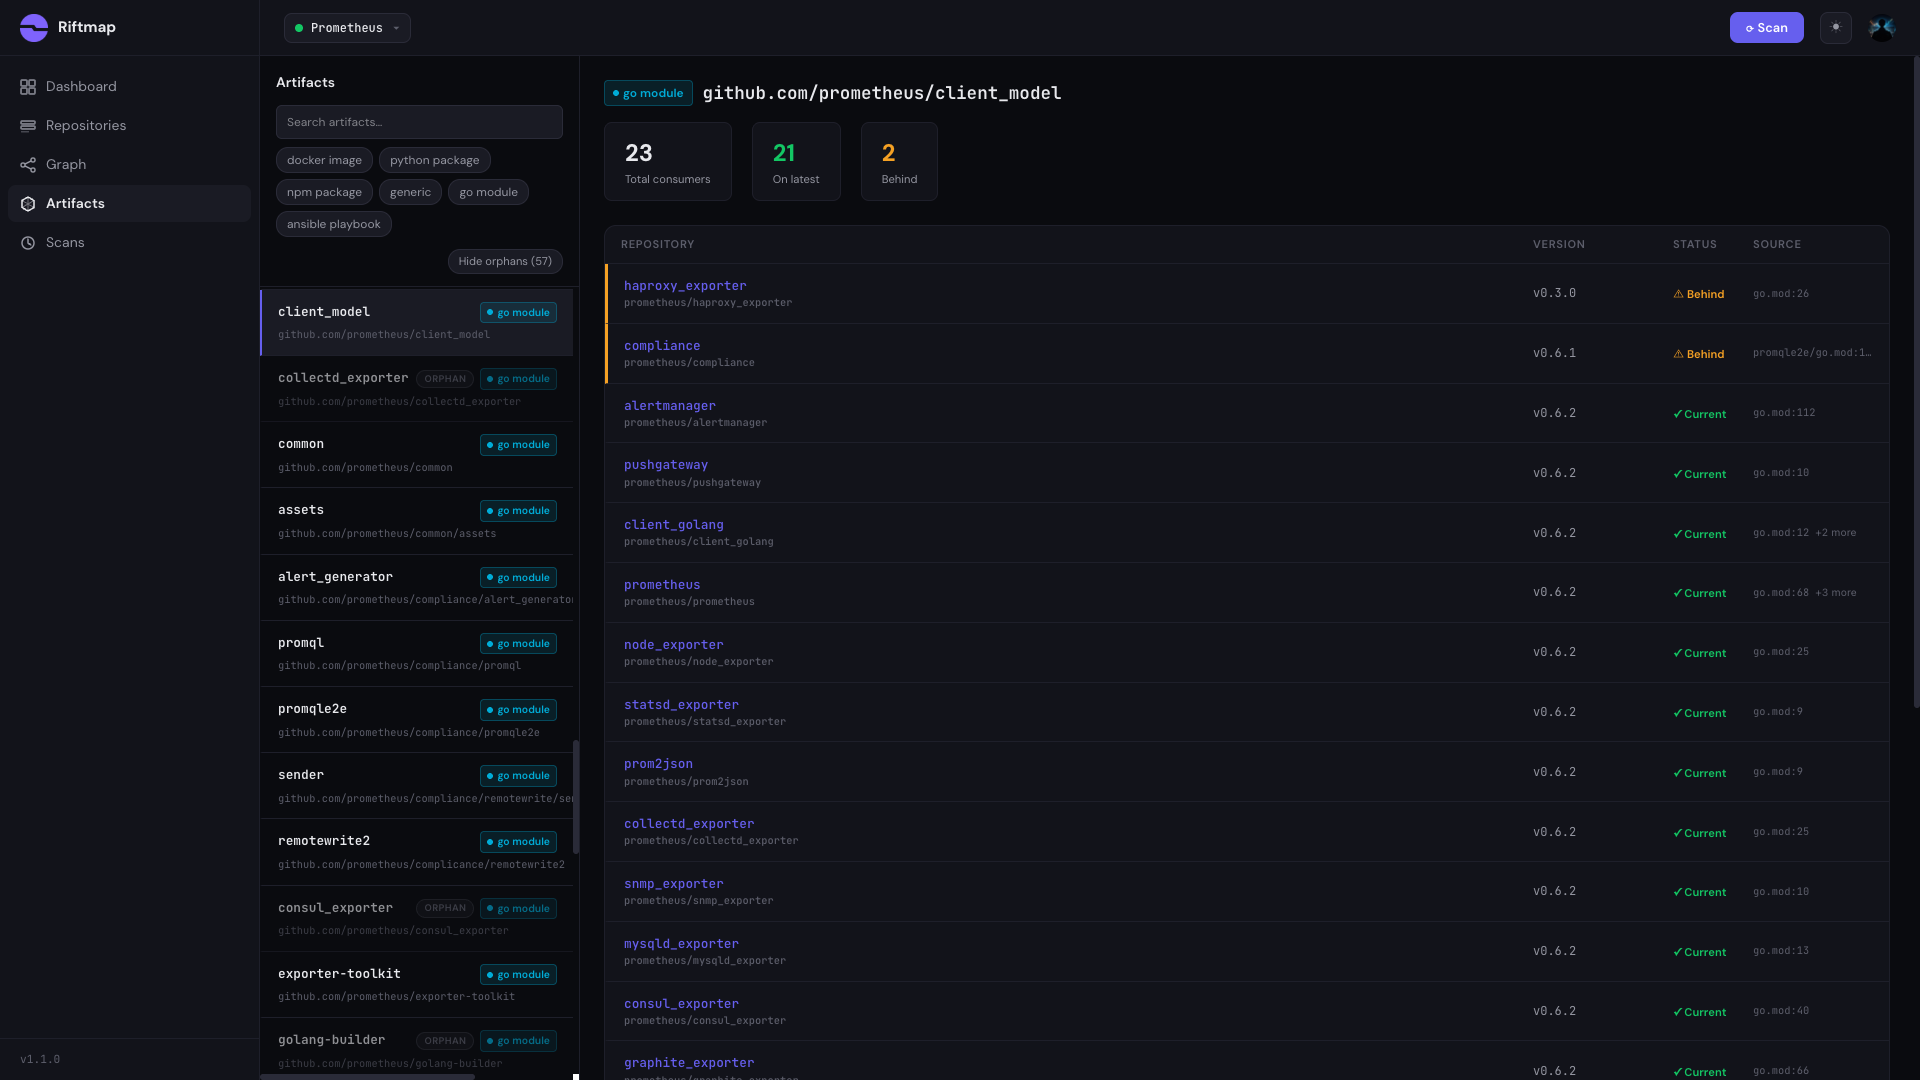
Select any artifact and see every consumer, direct and transitive — colour-coded by impact severity.
Which repos pull your Docker base image, and on what tag? Every consumer and the tag they pin, read straight from the graph.
No service catalog, no YAML to maintain — dependencies are parsed from the source files that already define them.
Dependencies came from a deterministic parser, not a model's guess. When a reference couldn't be resolved to a real target, Riftmap showed it as a visible unresolved edge — never a plausible one it made up.
One graph across Terraform, Docker, Python, Go, npm, Ansible, Helm, Kubernetes, Kustomize, ArgoCD, and CI templates — the real world doesn't respect ecosystem silos.
The same graph, served as JSON. Three endpoints — /lookup, /context, /impact — let Claude Code, Cursor, or any coding agent query the blast radius before they shipped a change.
$ curl api.riftmap.dev/api/v1/repositories/{id}/impact \
     -H "X-API-Key: $RIFTMAP_KEY"

{ "affected": [
    { "repo": "acme/platform-prod", "depth": 1 },
    { "repo": "acme/monitoring",    "depth": 2 }
], "total_affected": 7 }Ran as a managed cloud service — nothing to deploy. It needed only a read-only token, and source code was never stored permanently.
Who maintains what everyone else depends on? Bus factor from a year of git history, crossed with fan-in — single-maintainer repos with org-wide blast radius, flagged while they're still on the team.
The same graph engineers read in the UI, queried by a coding agent as a tool call during planning — before it changed anything.
Snapshot not a living graph, misses transitive deps, falls apart past 50 repos.
wrong toolA YAML catalog only as accurate as whoever last updated it. Stale within weeks. Full comparison
too heavyKeeps deps updated — tells you nothing about who consumes what. No blast radius.
partial onlyTerraform-only, HCP-only, and only module relationships — not the full cross-ecosystem picture.
partial onlyNot feasible for orgs with existing infra. And a monorepo still doesn't show blast radius.
not a solutionWorks until they leave. Six months of undocumented changes later, you're back to square one. Why the standard bus factor misses this
not a solutionGenuinely good up to ~50 repos. Past that, maintenance drifts and the agent re-discovers the graph on every invocation. The dependency graph is the substrate underneath — what the workspace pattern grows into.
until you outgrow itCode-symbol graphs built from AST parsing — they map functions and imports inside your code. None parse infrastructure: no Terraform, Helm, Docker, or CI edges, and most are single-repo or DIY-scaled and pip-installed per developer.
code onlyAmazon's incident memo put "high blast radius" into the mainstream tech press. Meta and Mabl shipped engineering posts the same spring, arguing from the agent side of the same problem. Three organisations, three angles, one conclusion: past a certain repo count, nobody can answer "what depends on this?" — and the cost of not knowing now shows up in incident reports.
Amazon's SVP of eCommerce Services attributed a pattern of production incidents partly to AI coding tools, in an internal memo whose pulled phrase was "high blast radius."
After shipping Cross Repo Base — an 850-line coordination graph across 79 repositories — context drift dropped from around 40% of agent failures to under 5%.
A cross-repo dependency lookup turned the question "what depends on X" from a multi-file exploration around 6,000 tokens into a single graph lookup around 200 tokens.
Three organisations. One conclusion. Riftmap was the productised version.
I posted in r/devops and r/terraform to test whether this was a real problem. Two threads, 86 comments and about 26,500 views later, the strongest signal wasn't a complaint.
Six of the people who replied in those threads described cross-repo dependency tooling they had built for their own teams, four of them by parsing the source files into a graph. The cards below show the range of what people had built — some from those threads, some from teams that wrote publicly about theirs. Each solved part of the problem for its own team. None of them productised it.
Build it overnight, query it in the morning.
Worked until ~80 repos. Grep across that volume gets expensive.
Custom crawler against the GitLab API, persisted to a database.
Maintenance burden grew faster than the rest of the platform team.
Parsing in CI, surfacing relationships per pipeline run.
Reasonable signal per repo. No transitive coverage across the org.
Closest to a real solution. A small team, half a quarter of work.
Worked once built. Nobody had time to keep it current.
Solo founder pattern. A registry plus a manager agent in the loop.
Holds together for one operator. Doesn't survive a team of ten.
A 25-engineer testing company, 79 repos, registry maintained by hand.
Effective at scale. Expensive enough that automating it is the next obvious move.
"I've looked at Backstage in projects before. In practice, setting it up and keeping it maintained is bigger than what you get back in many cases."
I'm Daniel, a software and DevOps engineer based in Norway. I built and ran Riftmap under Westgaard Technologies — the pattern above, finished instead of abandoned — until I shut it down in November 2026.
Why I built it, and why it shut down"What helped most was auto-generating a dependency map from Terraform sources, Dockerfiles, and shared CI includes. Once we had that, impact analysis got much easier — it stopped living in senior engineers' heads."
"The dependencies outside of Terraform is exactly where it gets unmanageable — pipeline scripts, triggers, Helm charts, Ansible roles, all referencing each other across repos with no single place to see the full picture."
"It's either build-your-own graph, lean on pinning to slow the blast radius, or accept the chaos."